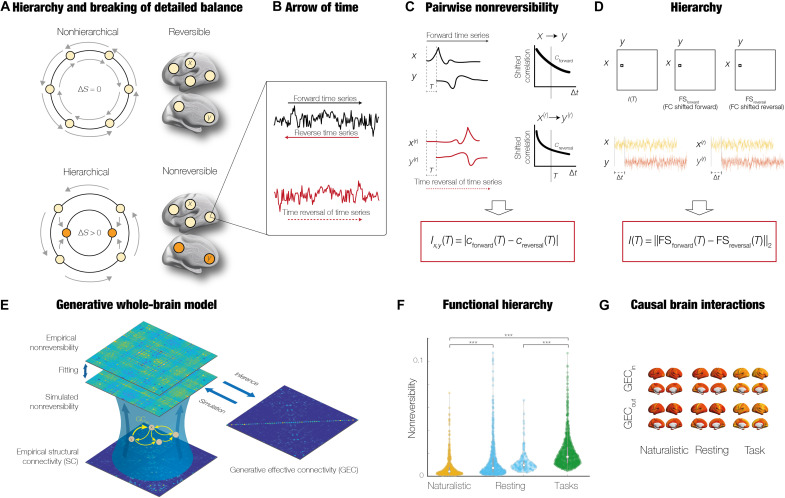
Fig. 1. GCAT framework for discovering underlying causal mechanisms of hierarchical organization.
(A) Level of hierarchy is given by the level of asymmetry of causal interactions between brain regions arising from the breaking of the detailed balance. The upper subpanel shows a nonhierarchical system in full detailed balance and thus fully reversible over time, i.e., no change in production entropy, S. In contrast, the bottom subpanel shows a change in production entropy, reflecting the asymmetry of the underlying causal interactions. (B) Estimating the arrow of time requires the forward time series of each region (in black) and the time-reversed time series (in red). (C) Basic principle of how the level of NR can be computed through the pairwise level of asymmetry using a time-shifted measure of the correlations between the forward (x, y) (top row) and the reversed [x(r), y(r)] time series (bottom row). The difference between these time-shifted correlations provides a quantification of the asymmetry in the interactions between pairs of regions (for a given shift ∆t = T). (D) Hierarchy is computed through the generalization of the pairwise NR for the whole brain, i.e., as a matrix involving all pairs. The hierarchy is given by the NR matrix, which is the difference between the two time-shifted correlation matrices for the forward and reversed time series (at a given shift time point ∆t = T; see Methods). (E) NR matrix is used to fit a whole-brain model creating the GEC, which provides the underlying causal mechanisms (see Methods). (F) Average of the NR matrix provides a model-free estimate of the hierarchy that can be contrasted over conditions. (G) Further mechanistic insights into hierarchy can be provided by rendering the in and out degree of the GEC matrix.

