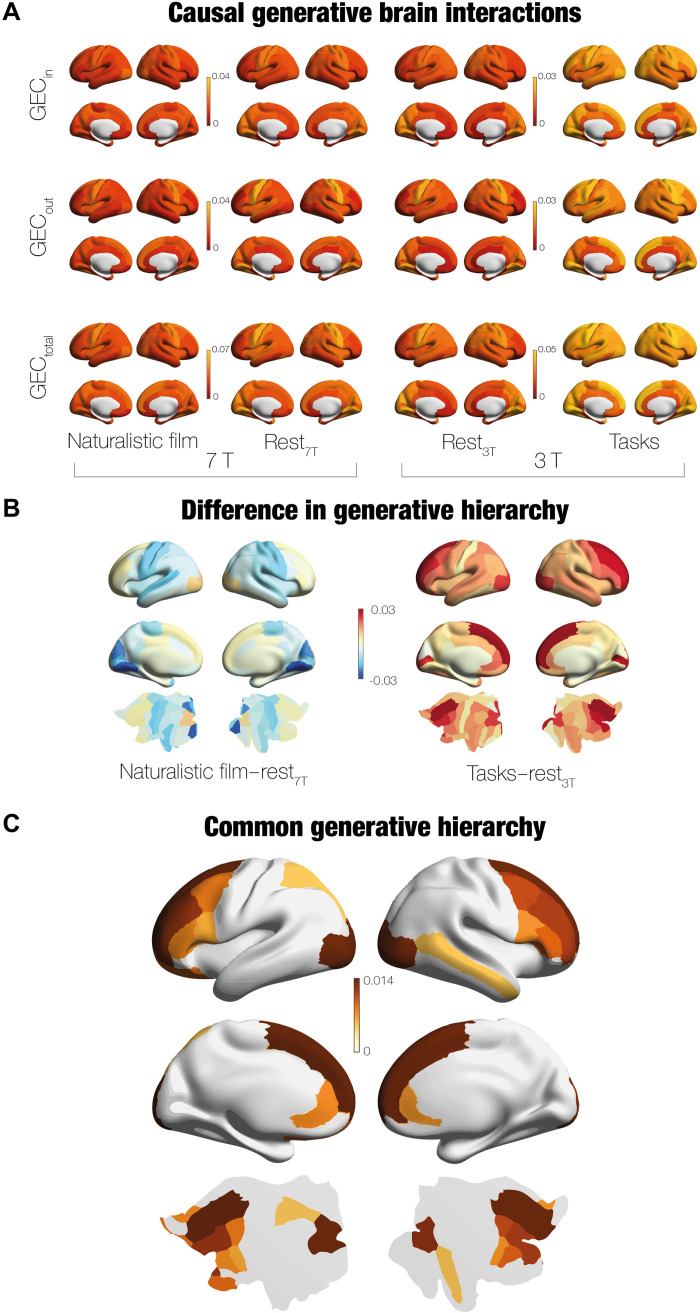
Fig. 4. Identifying the underlying causal drivers of hierarchy changes in movies, rest and tasks.
We can determine the information flow in terms of drivers and receivers by using the matrices of the GEC, obtained through using a whole-brain model for movies, rest, and tasks (fitted to both the model-free measures of NR and FC). This provides direct measures of the underlying brain hierarchy. (A) For all conditions, the figures show the receivers (incoming, Gin), drivers (outgoing, Gout), and their sum (Gtotal). The hierarchy is given by the gradations in color and, as can be seen movie, has a significantly lower hierarchy (deeper red) than both rest (orange) and task (strongest yellow). (B) Decrease in hierarchy in movies versus rest can be explicit shown by rendering the difference between their respective Gtotal. As can be seen from the colormap, where negative values are more blue and positive values are more yellow, only prefrontal and some visual regions are stronger for movies than rest. In other words, while the general hierarchy is flattened in movies, the prefrontal and visual regions are more nonreversible for movies, suggesting that the computation performed by these regions drives the breaking of the detailed balance when movie-watching. In contrast, when comparing the Gtotal for the average over all tasks versus rest, the general hierarchy is significantly larger for tasks and the main drivers of the computation is again found primarily in the prefrontal regions. (C) Confirming the role of prefrontal cortex in driving the breaking of the detailed balance, we computed the intersection of the top 50% regions of the contrasts shown in (B). This showed that primarily prefrontal regions (as well as some parietal, visual, and temporal) are the common drivers orchestrating computation in the brain.

