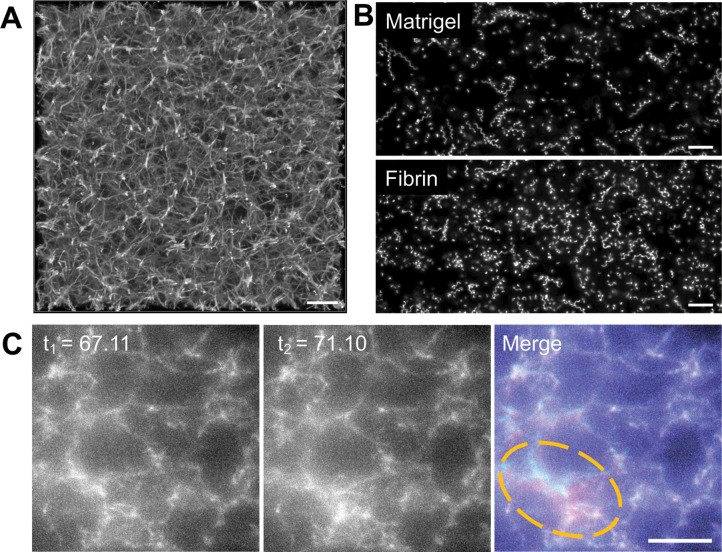
Figure 2. Parasite motility within a 3D fibrin matrix.
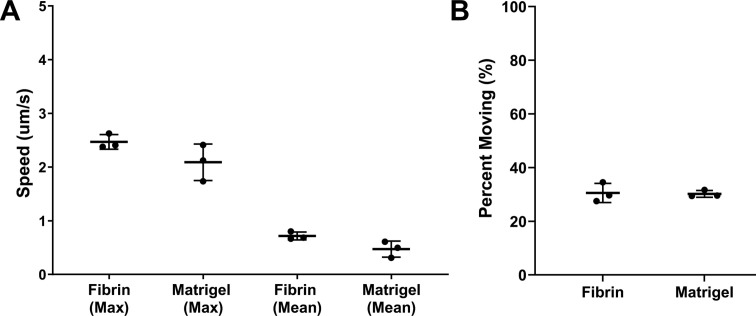
(A) Confocal imaging of a 2.25 mg/ml fluorescent fibrin gel. A maximum fluorescence intensity projection of 51 z-slices captured 0.25 µm apart is shown; scale bar = 10 µm. (B) Maximum fluorescence intensity projections showing the trajectories of tdTomato-expressing wildtype parasites moving in 3D in Matrigel (top) vs. fibrin (bottom). See Figure 2—figure supplement 1 for quantitative comparison of the motility parameters in the two matrices. Scale bar = 40 µm. (C) A parasite moving in a 1.3 mg/ml fluorescent fibrin matrix (see Video 5) visibly deforms the matrix, as evident from the non-coincident fluorescence signals in the highlighted area at the time points indicated (merge). Scale bar = 10 µm, timestamps in seconds.


