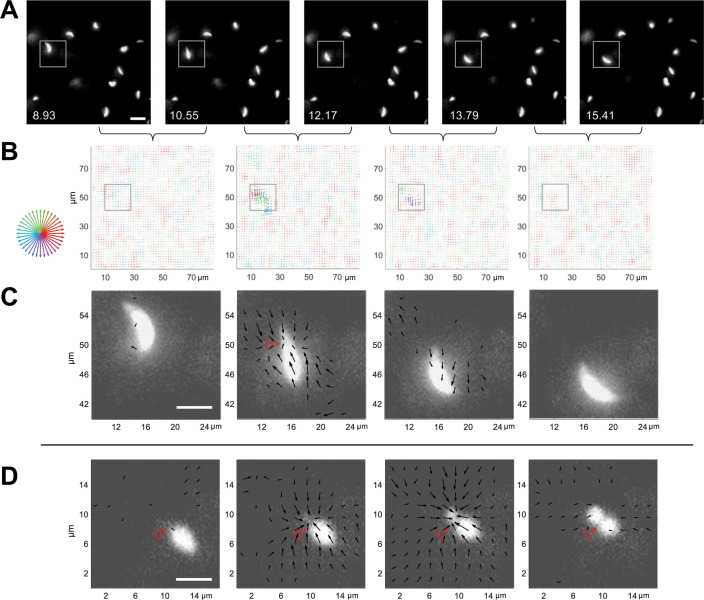
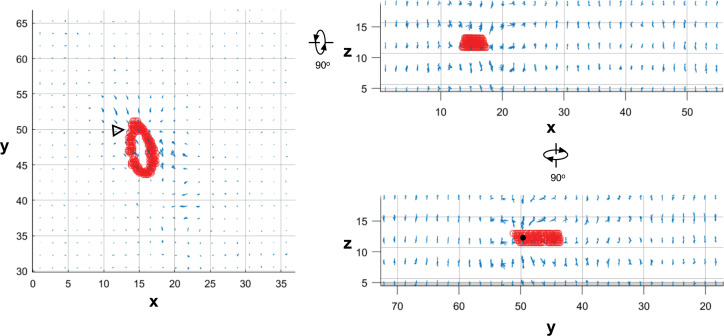
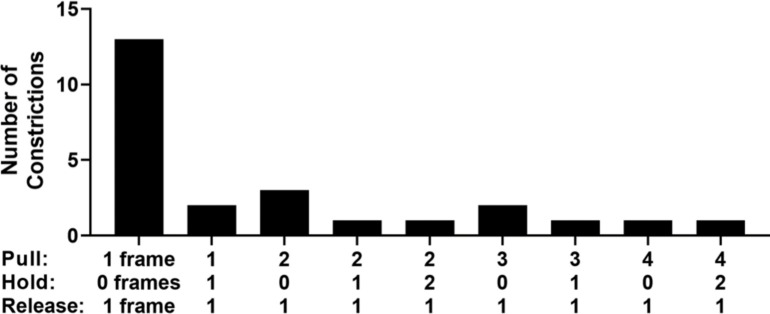
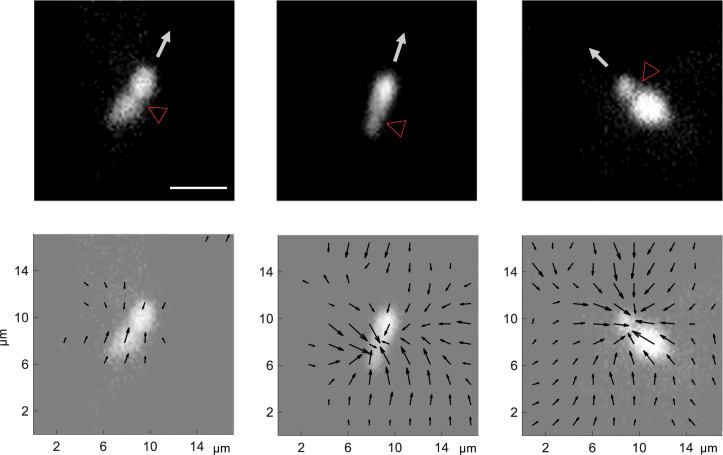
Figure 4. 3D traction force mapping in fluorescent fibrin reveals that the matrix is periodically pulled in toward the constriction during parasite motility.
(A) Sequential time series images, in a single z-plane, of a tdTomato-expressing parasite moving in fibrin (boxed). Scale bar = 10 µm, timestamps in seconds. (B) Force maps from the corresponding z subvolume plane of the data shown in panel A; each map depicts the motions of the fluorescent fibrin matrix between the two consecutive time points, as indicated by the brackets. Arrow length (multiplied 24-fold for display) indicates the magnitude of matrix displacement and arrow color the directionality (see color wheel). See Video 7 for the entire time series. (C) Zoomed images showing the force maps from the boxed region of panel B, after background subtraction (see text), overlaid on the parasite images from panel A. Length of arrows indicating displacement magnitude are multiplied 15-fold for display. Note inward displacement of the matrix in the second overlay image, outward displacement (relaxation) of the matrix in the third image, and no detectable displacement vectors in the fourth image even though the parasite continues to move. (D) Zoomed overlays of the force maps (background subtracted) and images of a moving parasite from a second dataset. The inwardly displaced matrix in this example did not relax back to its original position within the time frame of the experiment. Arrow lengths indicating displacement magnitude are multiplied 15-fold for display. See Video 8 for the entire time series. Scale bars in panels C and D=5 µm. Empty red arrowheads indicate position of the constriction.


