. 2022 Dec 15;11:e85171. doi: 10.7554/eLife.85171

Figure 6. 3D motility and force mapping of parasites lacking TgMyoA or TgMIC2.

(A) Brightfield images showing TgMyoA knockout and TgMIC2 knockout parasites moving within a Matrigel matrix without a detectable constriction. A wild-type parasite undergoing a typical constriction is shown for comparison. The TgMyoA knockout parasite makes right-angled ‘stairstep’ turn, and the TgMIC2 knockout parasite moves erratically in a tightly twisting arc. Scale bar = 5 µm, timestamps in seconds. See Videos 11 and 12 for the entire time series for the TgMyoA and TgMIC2 knockout parasites. (B–E) As in Figure 3A, the plots show the magnitudes of the 16,807 fibrin x-y displacement vectors between each pair of successive image volumes generated in experiments using: (B) TgMyoA knockout parasites; (C) TgMIC2 knockout parasites; (D) wild-type parasites; and (E) no added parasites (fibrin only). Periods during the 96-second time course when parasites were moving are indicated. For each time course, the two consecutive time points that gave the lowest mean displacement magnitude were used to set the background threshold: any displacements less than three standard deviations (3SD) above this mean were considered noise for that dataset. Examples of the force maps surrounding motile TgMyoA and TgMIC2 knockout parasites are shown in Figure 6—figure supplements 1 and 2, respectively.

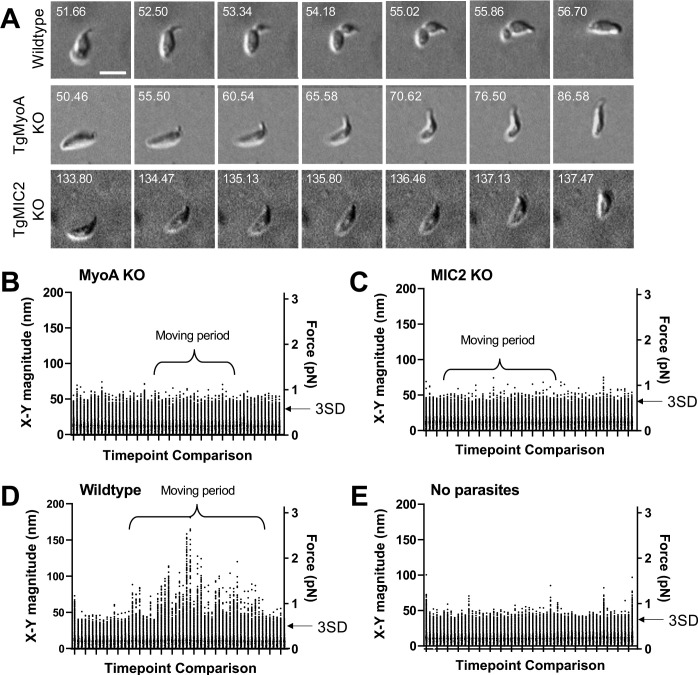
Figure 6.

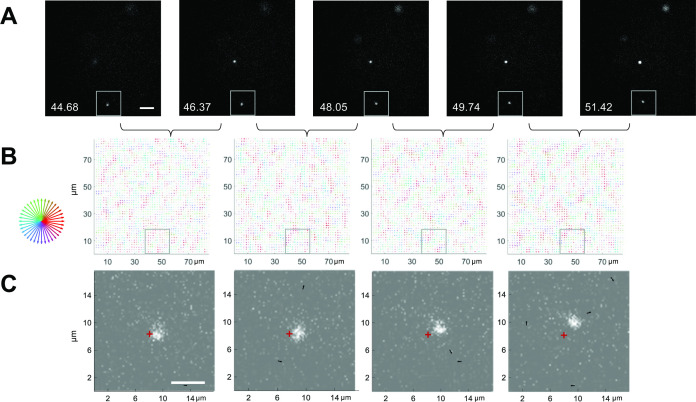
Figure 6—figure supplement 1. The small number of TgMyoA knockout parasites that move more than one body length produce no detectable force on the fibrin matrix.

Figure 6—figure supplement 1.

(A) Sequential fluorescence images in a single z-plane of a moving TgMyoA knockout parasite stained with Hoechst 33342 (to label the parasite nucleus), (B) the corresponding force maps, and (C) the zoomed images showing the force maps from panel B (boxed region), with background subtraction, overlaid on the parasite images from panel A. A red crosshair placed at a fixed position in the images in panel (C) illustrates movement of the parasite. The highlighted parasite continued to move for another 24 seconds; no signal above background was seen on the force maps at any time along its trajectory. Length of arrows indicating displacement magnitude are multiplied 24-fold in (B) and 15-fold in (C) for display. Scale bar = 5 µm, timestamps in seconds.
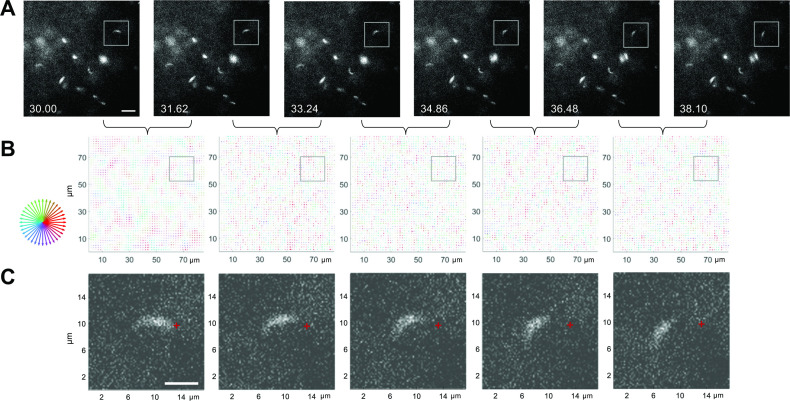
Figure 6—figure supplement 2. Moving TgMIC2 knockout parasites produce no detectable force on the fibrin matrix.

Figure 6—figure supplement 2.

(A) Sequential fluorescence images in a single z-plane of a moving TgMIC2 knockout parasite expressing YFP, (B) the corresponding force maps, and (C) the zoomed images showing the force maps from panel B (boxed region), with background subtraction, overlaid on the parasite images from panel A. A red crosshair placed at a fixed position in the images in panel C illustrates movement of the parasite. The highlighted parasite continued to move for another 18 seconds; no signal above background was seen on the force maps at any time along its trajectory. Length of arrows indicating displacement magnitude are multiplied 24-fold in panel C and 15-fold in panel D for display. Scale bars = 10 µm (panel A), 5 µm (panel C); timestamps in seconds.