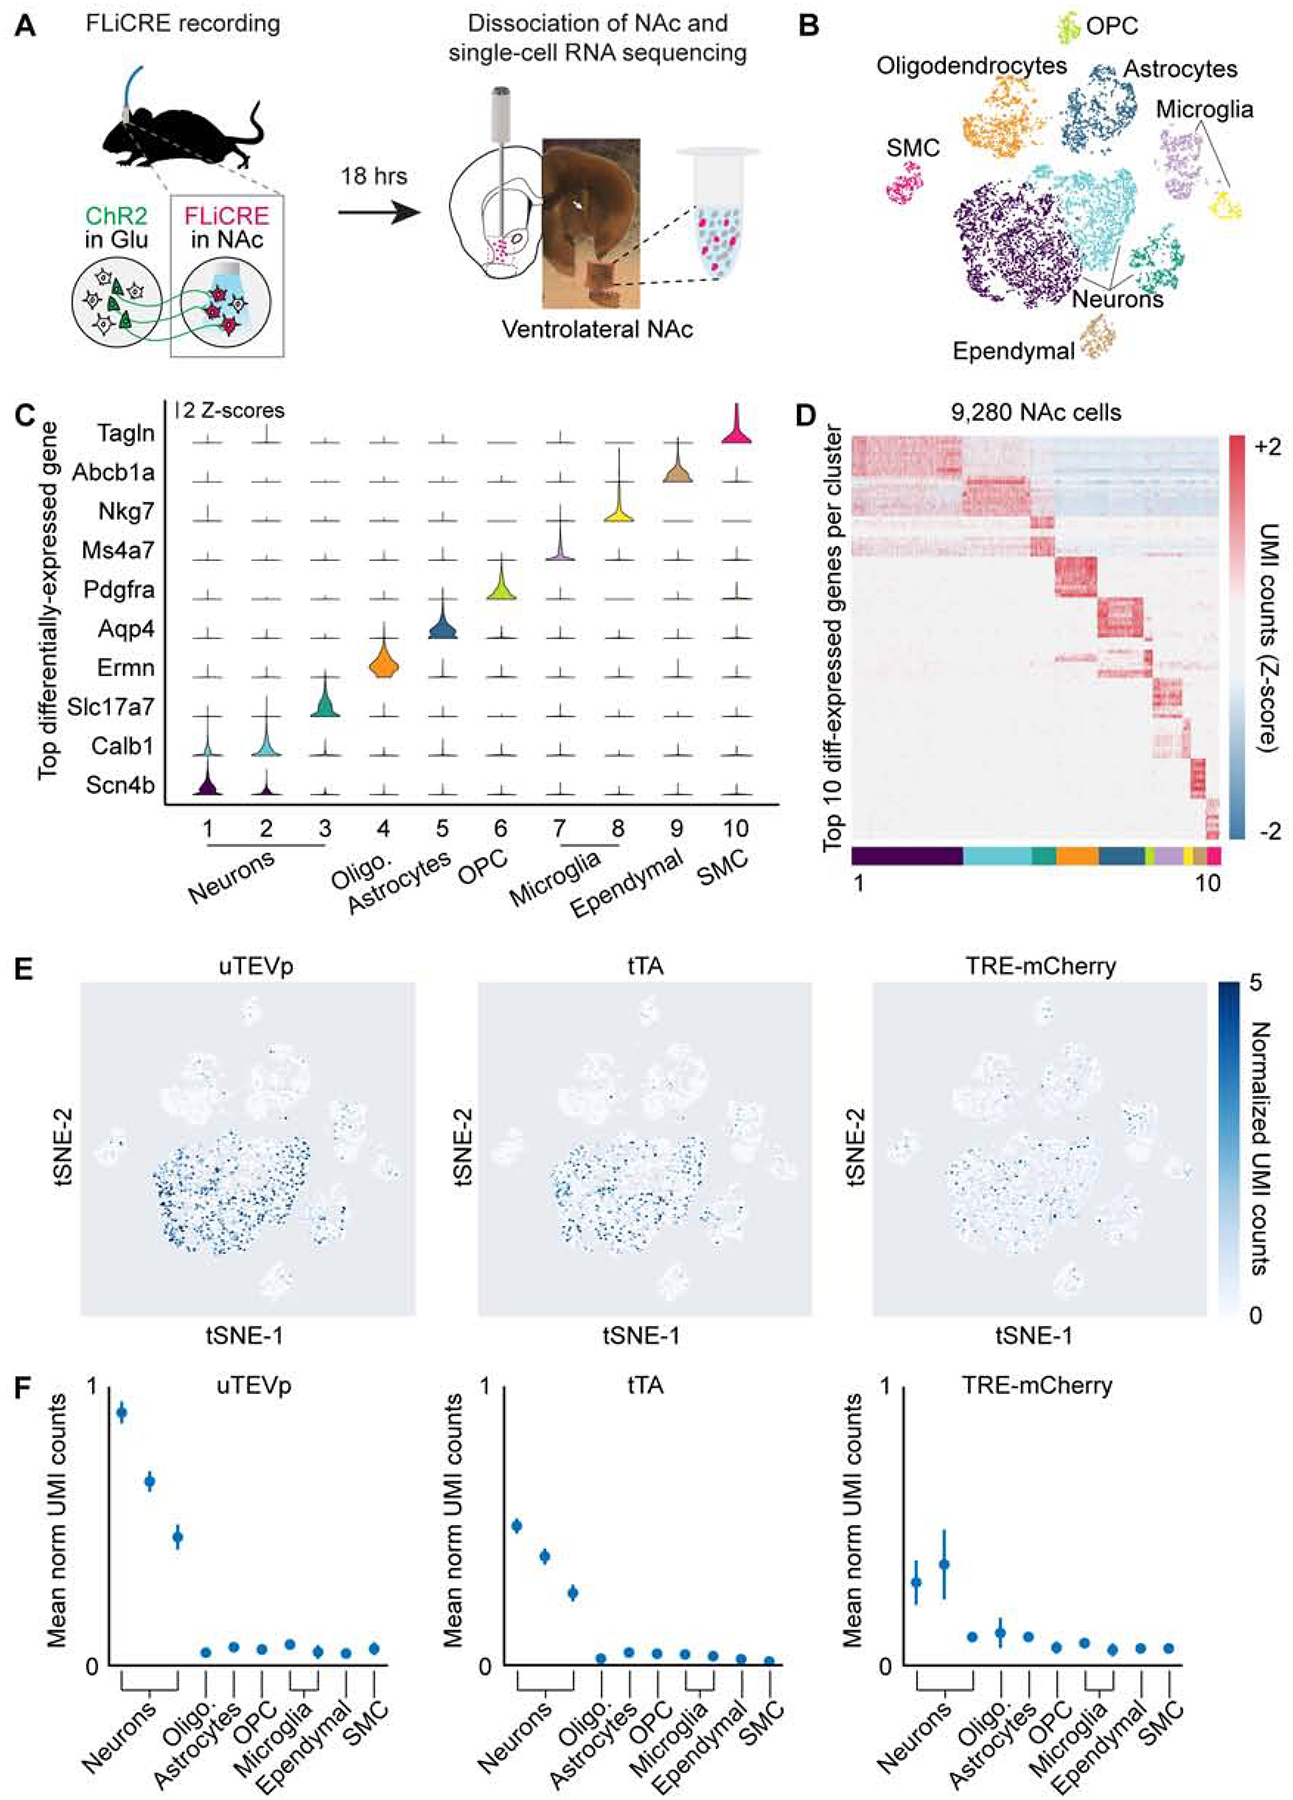
Figure 4. Detection of FLiCRE components using single-cell RNA sequencing.

(A) Schematic for scRNA-seq following hLOV1 FLiCRE recording during afferent excitatory axon stimulation in NAc (as in Figure 3E). Single-cell libraries were generated using 10X Genomics kits and sequenced using Illumina Nextseq.
(B) t-distributed stochastic neighbor embedding (t-SNE) of ~10,000 cells passing quality control metrics, colored by clustering analysis. Data clustered using unsupervised K-means clustering (cells pooled across 3 experimental replicates from 5 mice).
(C) Violin plots of the top-differentially expressed gene identified per cluster. Y-axis represents Z-scored normalized UMI counts (see STAR Methods).
(D) Heatmap of the top 10-differentially expressed genes identified per cluster. Normalized UMI counts for each gene were Z-scored across clusters.
(E) Heatmap of normalized UMI counts detecting uTEVp, tTA, and mCherry across all cells plotted in t-SNE space.
(F) Mean normalized UMI counts calculated for cells in each cluster type. FLiCRE transcripts were detected in cell clusters corresponding to neurons.
