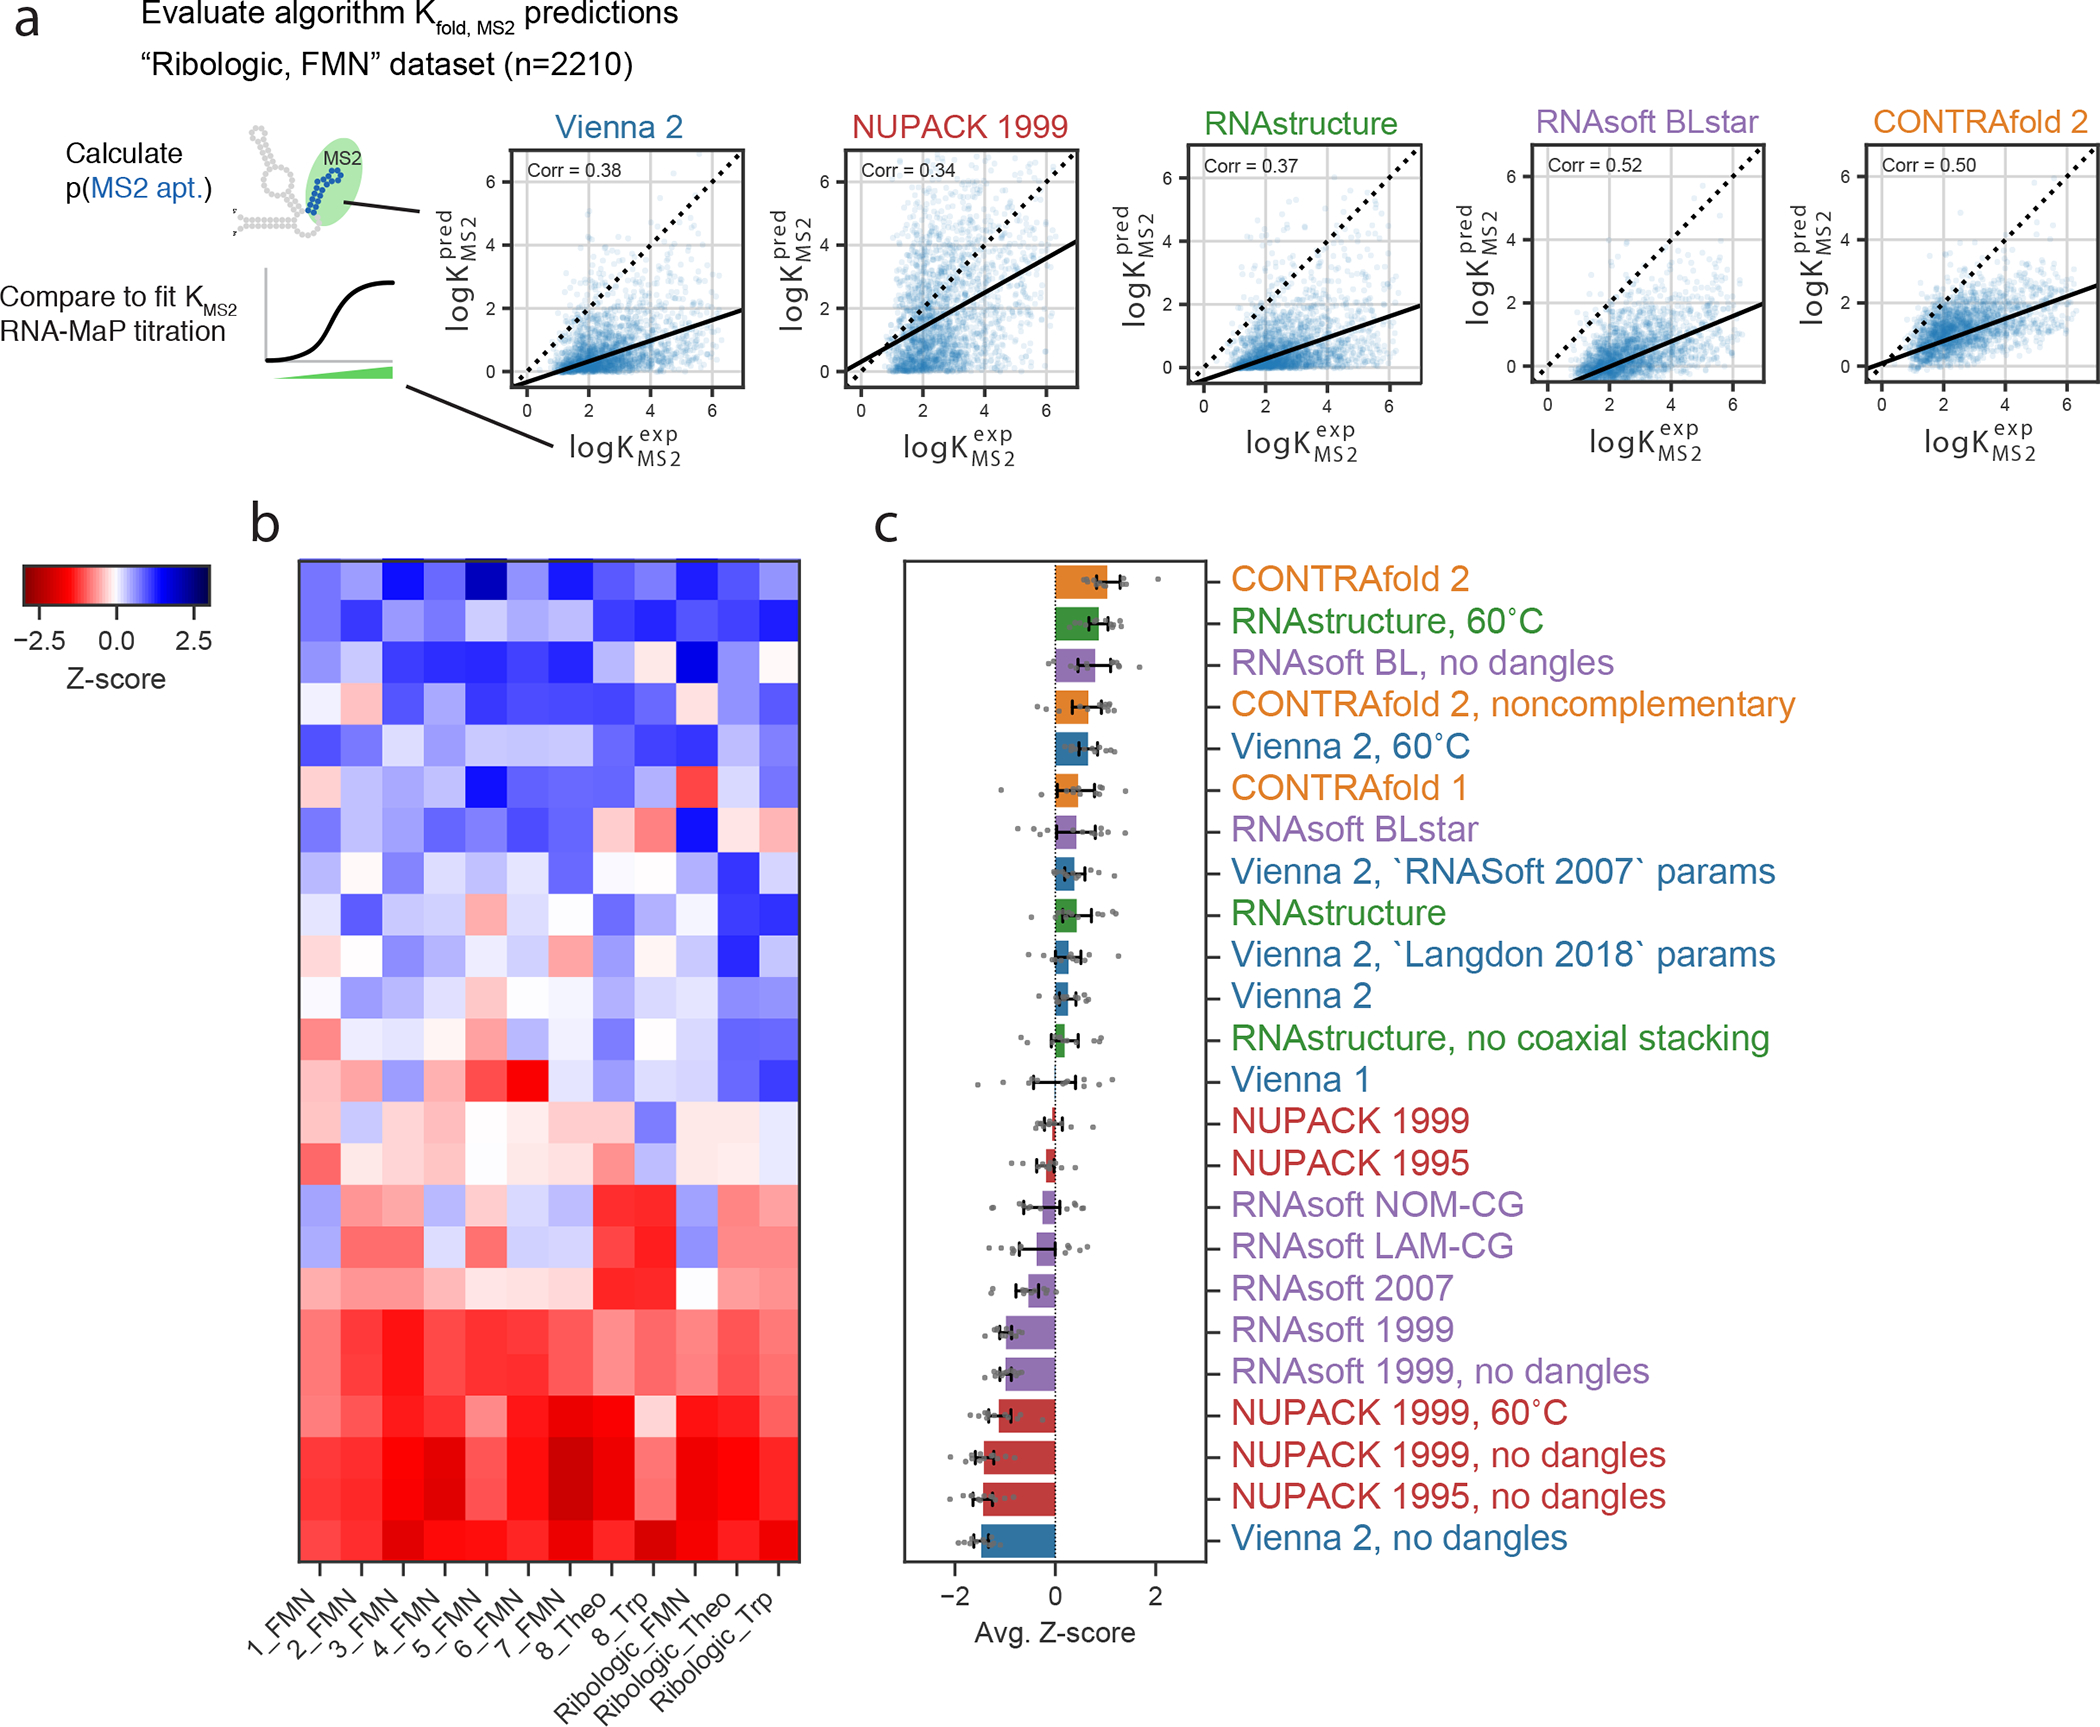
Figure 2. Riboswitch affinity predictions reveal similar package ranking.

(A) Representative scatterplots for the Ribologic-FMN dataset of experimental vs. predicted values of . (B) Calculating the Z-scores of Pearson correlation coefficients across 12 independent datasets of riboswitches result in an overall ranking (C) consistent with the Chemical Mapping dataset. Error bars represent 95% confidence interval of the mean obtained over 1000 iterations of bootstrapping over n=12 independent experiments of 7,228 independent constructs total.
