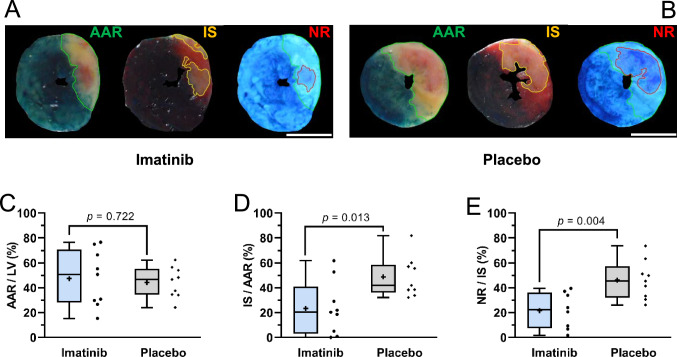
Fig. 3.
Cohort A: Imatinib reduces IR injury in vivo as assessed by triple staining with Evans-blue/Thioflavin-S/TTC. Evans-blue delineates the area at risk (AAR, green line), TTC delineates the infarct area (IS, yellow line), and Thioflavin-S delineates the area of no-reflow (NR, red line). White scale bar represents 5 mm. Representative images of a rat of A, imatinib group and B, placebo group. C, Area at risk as percentage of left ventricle is comparable between groups. Imatinib significantly reduced D, infarct size as percentage of area at risk, and E, no-reflow area as percentage of infarct size, compared to placebo. Every ● represents one rat (blue, imatinib n = 9; grey, placebo; n = 9). The plus sign represents the mean. Data is presented as median with IQR, whiskers min to max, and assessed by independent-samples T test (C, D, E). LV left ventricle

