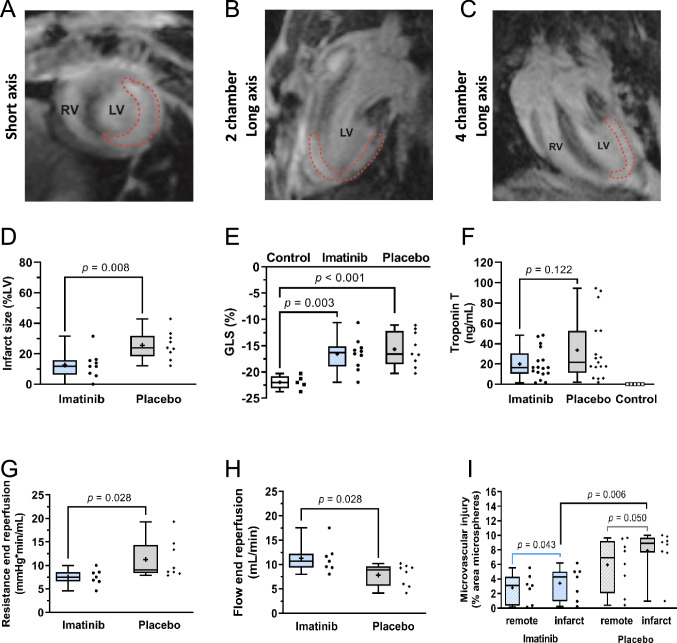
Fig. 4.
Cohort B: Imatinib reduces IR injury in vivo. Infarct size is determined with an extracellular gadolinium-based contrast agent in consecutive short axis images. Representative images of LGE CMR in A, short axis, B, 2 chamber long axis, C, 4 chamber long axis, in which the infarct area is marked with a red dotted line. D, Imatinib significantly reduced infarct size (imatinib n = 9, placebo n = 9), but E, did not alter global longitudinal strain (imatinib n = 10, placebo n = 9, non-infarcted control n = 5). F, Troponin T was not significantly different between imatinib and placebo (n = 17 in both groups; in three animals the tail vein cannula was clogged during reperfusion phase). Under controlled perfusion pressure, treatment with imatinib resulted in G, lower vascular resistance and H, higher coronary flow (imatinib n = 7, placebo n = 8). I, Administration of a microvascular leakage tracer showed less fluorescent microsphere extravasation in the infarct area in the imatinib group compared to the placebo group (expressed as %area of fluorescent microspheres) (imatinib n = 7, placebo n = 8). Every ● represents one rat (D–I). The plus sign represents the mean. Data is presented as median with IQR, whiskers min to max, and assessed by independent-samples T test (D, E, H), Mann–Whitney U test (F, G, I) or Wilcoxon signed-rank test to compare infarct to remote area (I). GLS global longitudinal strain, LV left ventricle, RV right ventricle

