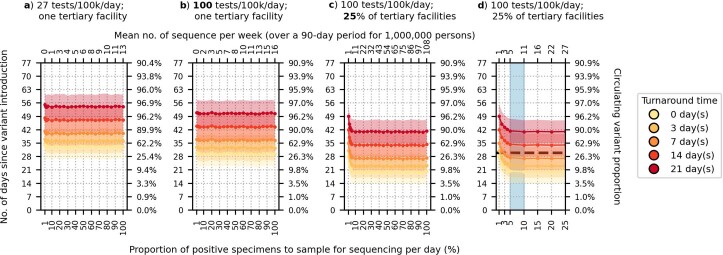
Extended Data Fig. 6. Recommended approach to enhance genomic surveillance robustness.
In each plot, the operating curves of the expected day when the first Omicron BA.1 variant sequence is generated are plotted for different proportion of specimens to sample for sequencing per day and turnaround times. We assumed that the Omicron BA.1 variant was circulating at 1% initially with Delta variant in the background. We also assumed that positive specimens sampled within each week for sequencing are consolidated into a batch before they are referred for sequencing. Turnaround time refers to the time between collection of each weekly consolidated batch of positive specimens to the acquisition of its corresponding sequencing data. The vertical axes denote the number of days passed since the introduction of the Omicron variant (left) and its corresponding circulating proportion (right). The horizontal axes denote the proportion of positive specimens to sample for sequencing per day (bottom) and the corresponding mean number of sequences to be generated per week per 1,000,000 people over a 90-day epidemic period. (A) Specimen pools for sequencing from one tertiary facility with testing rate at 27 tests per 100,000 persons per day (tests/100 k/day). (B) Specimen pools for sequencing from one tertiary sentinel facility with testing rate at 100 tests/100 k/day. (C) Specimen pools for sequencing from 25% of all tertiary facilities acting as sentinel sites with testing rate at 100 tests/100 k/day. (D) Zoomed-in plot of (C) for sequencing proportions varying between 1–25%. Sequencing 5–10% of positive specimens (blue shaded region) would ensure that we would expectedly detect Omicron within 30 days if turnaround time is kept within one week. All results were computed from 1,000 random independent simulations for each surveillance strategy. The shaded region depicts the standard deviation across simulations.

