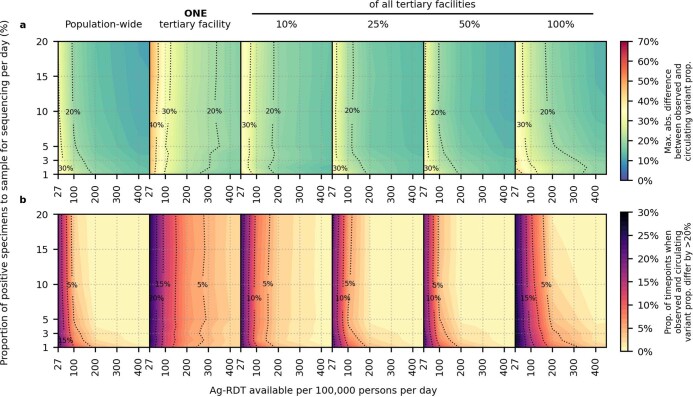
Extended Data Fig. 1. Impact of SARS-CoV-2 Ag-RDT testing rates and daily proportion of positive specimens to sample for sequencing on observed Omicron variant proportions.
Different genomic surveillance strategies (that is all specimens collected from all healthcare facilities sent to one facility to be sampled for sequencing (population-wide strategy); only one, 10%, 25%, 50% or 100% of all tertiary facilities acting as sentinel sites that would sample the specimens they collected for sequencing) were simulated. (A) Maximum absolute difference between observed and circulating variant proportions. (B) Proportion of timepoints when sequencing was performed that the absolute difference between observed and circulating variant proportions is greater than 20%. All results were computed from 1,000 random independent simulations for each surveillance strategy.

