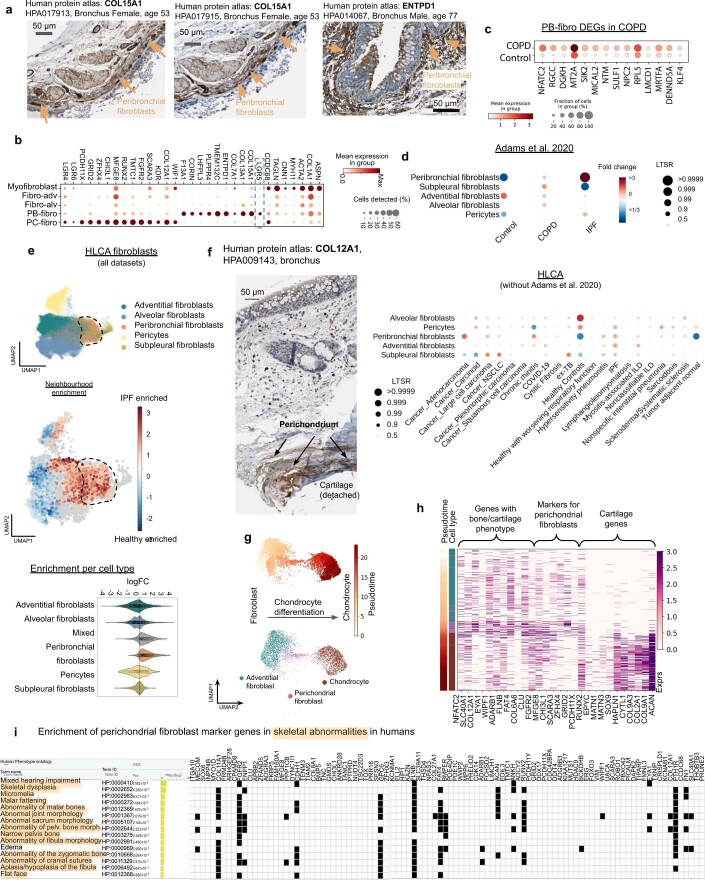
Extended Data Fig. 4. Peribronchial and perichondrial fibroblasts.
(a) Protein staining of PB-Fibro markers (COL15A and ENTPD1) in human bronchus sections from the HPA. (b) Marker genes for PB-fibro and PC-fibro. (c) Upregulated genes in COPD patient’s PB-fibro cells (74 cells, 12 donors) compared to controls (20 cells, 9 donors) from scRNAseq data98. Selected upregulated genes associated with COPD or emphysema by GWAS (RGCC, DGKH, NTM, SULF1, NPC2, RPL5, LMCD1, MRTFA, DENND5A, KLF4) or in other studies (NFATC2, MT2A and SIK2). Wilcoxon rank sum test p < 0.05 (two sided), exact P values and full list is in Supplementary Table 10. (d) Cell type proportion analysis using PLMM to compare fibroblasts in the extended HLCA across disease conditions with fold changes and Local True Sign Rate (LTSR). Covariates are listed in the methods. Cell abundances were analysed in Adams et al. 2020 dataset only, and validated in the extended HLCA (minus Adams et al. 2020). (e) Milo cell type abundance analysis of fibroblasts from the HLCA comparing IPF patients and healthy controls. UMAP of fibroblast clusters, neighbourhood enrichment UMAP showing log fold change in IPF compared to healthy, and violin plot of log fold change of the neighbourhood for each cell, grouped by cell type. Dashed line highlights the region of PB fibros on the UMAPs. (f) Protein staining of PC-Fibro marker (COL12A1) in human bronchus from the HPA mapping to cartilage. (g) UMAP of adventitial fibroblasts, PC-fibro and chondrocytes from single nuclei data coloured by monocle 3 pseudotime and cell type. (h) Expression of genes associated with bone/cartilage function, markers of PC-fibro and cartilage genes in the nuclei as shown on (g), ordered by pseudotime. (i) PC-fibro marker gene enrichment in Human Phenotype Ontology by g:Profiler.

