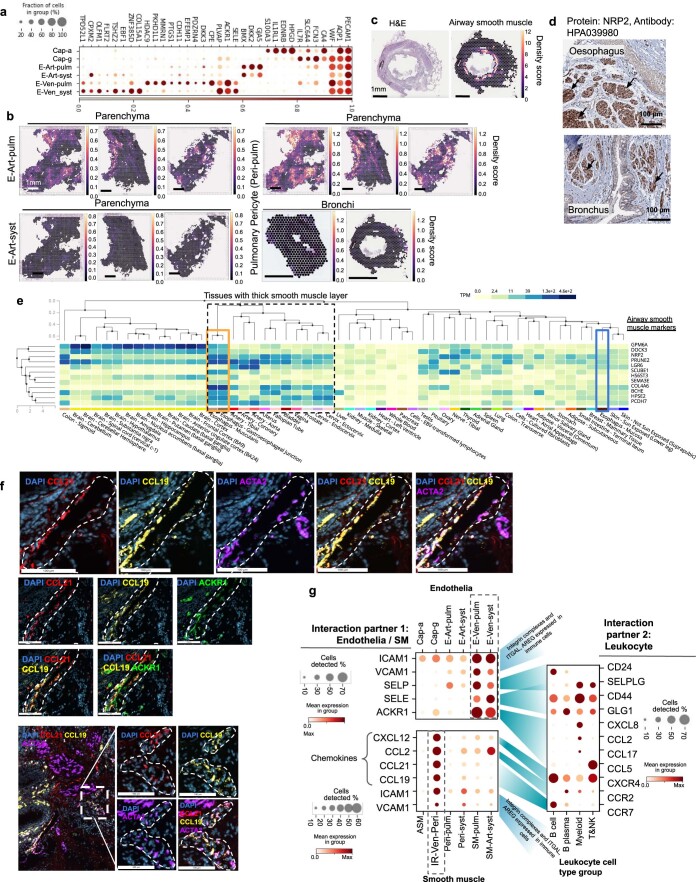
Extended Data Fig. 6. Vascular and smooth muscle cell types.
(a) Markers dot plot for vascular endothelia. (b) cell2location density scores of pulmonary and vascular endothelium for parenchyma and bronchi Visium ST sections. (c) Bronchi section with H&E and cell2location analysis density score for airway smooth muscle population on a Visium ST slide. (d) NPR2 staining in oesophagus and bronchus from the HPA. Black arrows indicate the airway and oesophagus surrounding non-vascular smooth muscle. (e) ASM marker expression in all GTEx tissues. Tissues are ordered by unsupervised clustering based on expression similarity. The dotted line highlights tissues which are surrounded by a thick smooth muscle layer. The orange rectangle shows muscular tissues from oesophagus, and the blue rectangle shows the non-muscular mucous layer of oesophagus tissue. (f) IR-Ven-peri markers localise at the venous vessels in the airway. smFISH staining for IR-Ven-peri (CCL21, CCL19), venous endothelia (ACKR1) and smooth muscle (ACTA2) markers. (g) Leukocyte rolling and homing genes, and chemokines expressed in Endothelia and SM/Perivascular cells together with their interaction partners expression in immune cell groups. Interaction partners are indicated with blue shades.

