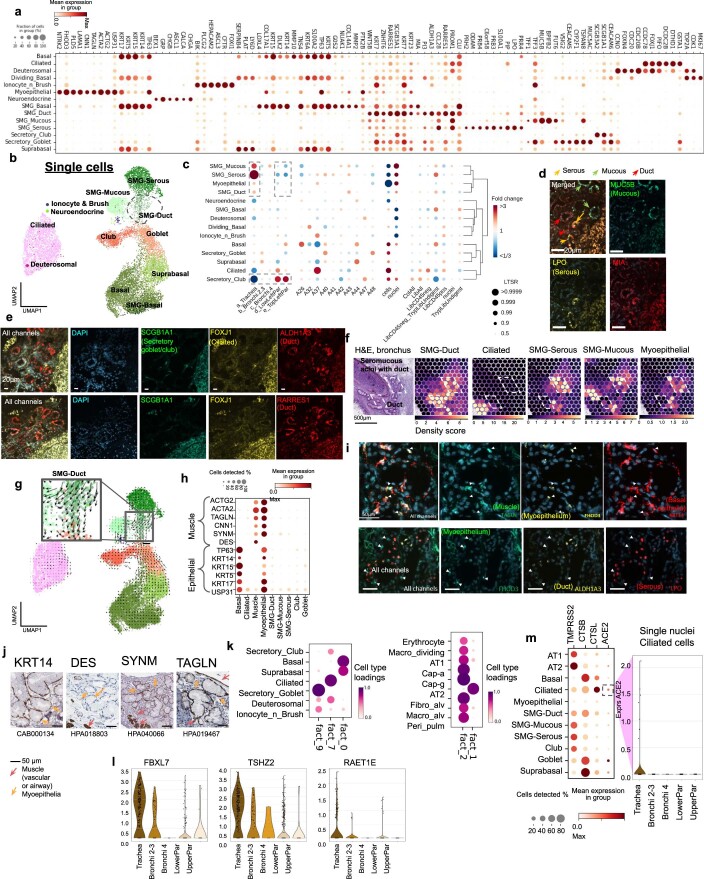
Extended Data Fig. 7. Epithelial cell annotations and location specific ciliated cell gene expression.
(a) Marker gene expression dot plot for airway epithelial cells. (b) UMAP of airway epithelial cells from scRNA-seq data. (c) Cell type proportion analysis with fold changes and Local True Sign Rate (LTSR) score for all cell type groups with regards to variables shown. Cell numbers are in Supplementary Table 7. (d) smFISH staining for mucous (MUC5B), serous (LPO) and duct (MIA) cell markers in human bronchi sections. (e) smFISH staining of secretory goblet/club (SCGB1A1), ciliated (FOXJ1) and duct (ALDH1A3/RARRES1) in human bronchus section. (f) Visium ST H&E from bronchial section and cell2location density values for mapping duct, mucous, serous, ciliated and myoepithelial cells. (g) RNA velocity results on UMAP from scRNAseq of airway epithelia. Colours indicate cell types as in (b). (h) Myoepithelial marker gene expression dot plot. (i) smFISH staining for muscle (TAGLN), basal epithelia (KRT14), duct (ALDH1A3) and myoepithelium (FHOD3) in human bronchi sections. (j) HPA staining for muscle and epithelial marker proteins in human bronchial glands. (k) Unsupervised non-negative matrix factorisation (NMF) analysis of Visium ST cell2location results for 11 factors showing NMF factor loadings normalised per cell type (dot size and colour). Other factors/cell types are shown in Supplementary Fig. 4. (l) Violin plots of normalised log-transformed expression separated by location in the single nuclei RNA-seq data for 3 genes upregulated (methods) in nasopharyngeal carcinoma gene set from GSEA database with LTSR>0.9 consistently higher expressed in the trachea. (m) SARS-CoV-2 receptor and viral entry gene (ACE2) expression in ciliated cells from snRNA-seq data shown by location in a violin plot.

