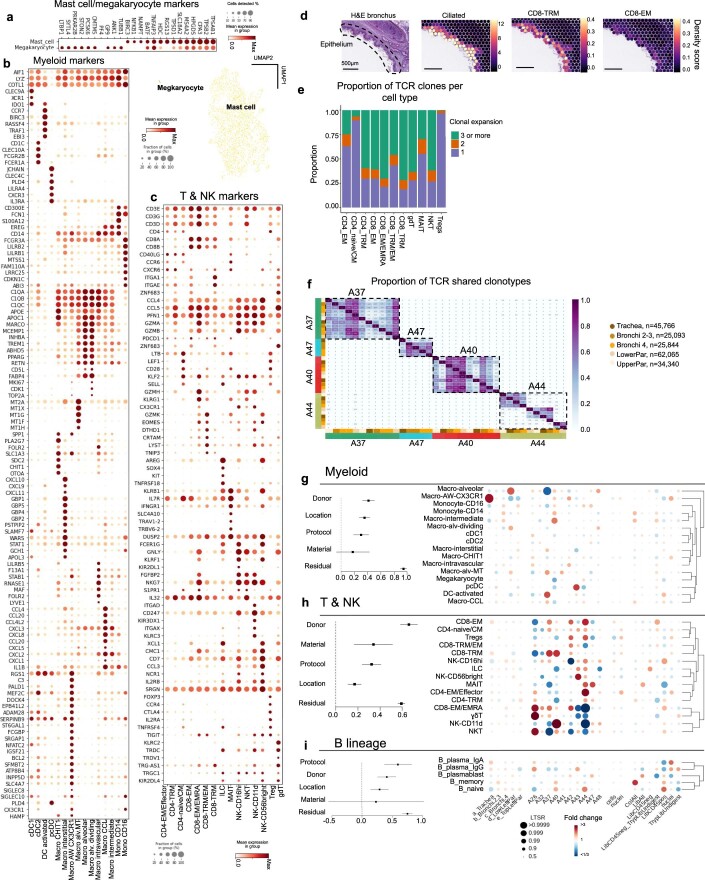
Extended Data Fig. 8. Immune cell type groups.
(a) Marker gene expression plot along with UMAP for Megakaryocytes and Mast cells. (b) Marker genes dot plot for Myeloid cells. (c) Marker genes dot plot for T & NK cells. (d) cell2location density scores for CD8-TRM, Ciliated and CD8-EM cell types in human bronchi sections and corresponding H&E. (e) Fraction of clonally expanded cells in T & NKT cell types from VDJ data. (f) Proportion of shared TCR clonotypes between samples from VDJ data. Colour bars indicate location and donor. (g-i) Effects of location, donor, material and protocol on immune cell type proportions (assessed by PLMM) are shown by forest plots. Each square dot with an error bar shows the square root of variance explained by each factor and its 95% confidence interval, respectively. Dotplots show point estimates of fold changes and Local True Sign Rate (LTSR) for myeloid cell types (g), T & NK cell types (h) and B lineage cell types (i). The number of cells in each cell type group are in Supplementary Table 7.

