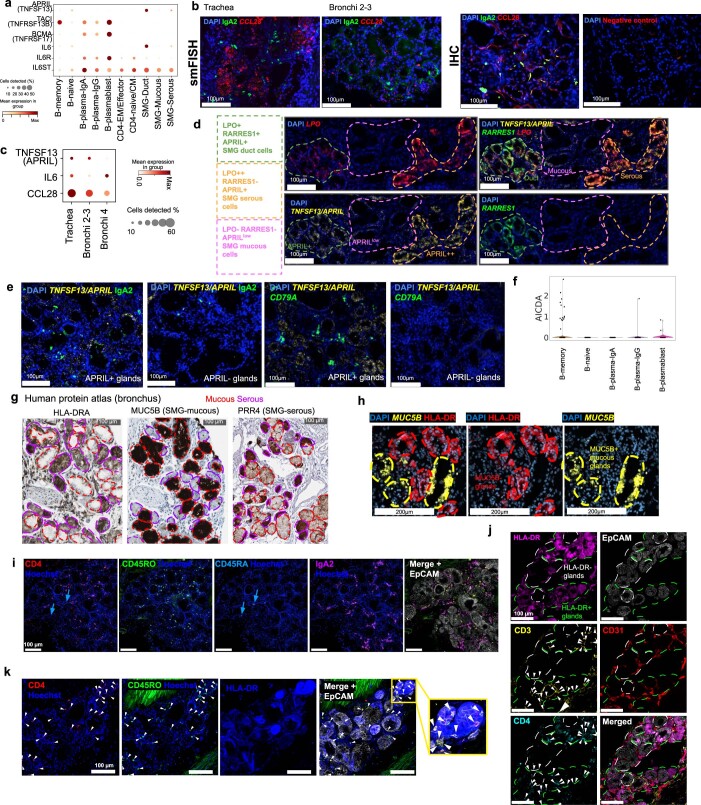
Extended Data Fig. 10. Additional gland associated immune niche data - interactions of gland epithelial cells with immune cells.
(a) Expression dot plot of genes relevant for Figure 5h. (b) Co-staining of CCL28 RNA/protein and IgA2 protein in airway submucosal glands, left: smFISH; right: IHC for CCL28. (c) Expression of TNFSF13, IL-6 and CCL28 in SMG-Serous and Duct cell sc/snRNAseq data along the tracheobronchial tree. Change in CCL28 in serous cells was statistically significant with two-sided Spearman’s rank correlation (methods) (p-values 1.6 × 10⁻⁸, 0.0034 and 1.3 × 10⁻⁵ for donors A37, A41 and A42 correspondingly). (d) smFISH on the human trachea with DAPI, TNFSF13/APRIL, RARRES1 and LPO. Dashed lines show regions of duct, mucous and serous glands. (e) smFISH (TNFSF13/APRIL, and CD79A) and IHC (IgA2) of human tracheal SMG showing APRIL+ and APRIL- glands annotated. (f) Violin plot for expression of AICDA in B cell subsets. (g) IHC from the HPA showing HLA-DR, MUC5B and PRR4 staining with HLA-DR+ regions corresponding with non-mucous areas of gland. Red/purple dashed lines indicate mucous/serous cells respectively based on morphology and/or marker gene expression. (h) smFISH (MUC5B) plus IHC (HLA-DR) staining in human airway SMG. (i) IHC staining of CD4, CD45RO (memory marker), CD45RA (naive marker), IgA2 and EpCAM in the SMG. Blue arrows indicate CD4+CD45RA+ cells. (j) IHC staining of HLA-DR, EpCAM, CD3, CD31 and CD4 in the airway SMG. Arrows point to CD3+CD4+ cells. (k) IHC staining of CD4, CD45RO, HLA-DR and EpCAM in the airway SMG showing close interactions between CD4+CD45RO+ T cells with HLA-DR+ glands. Arrows point to CD4+CD45RO+ cells.

