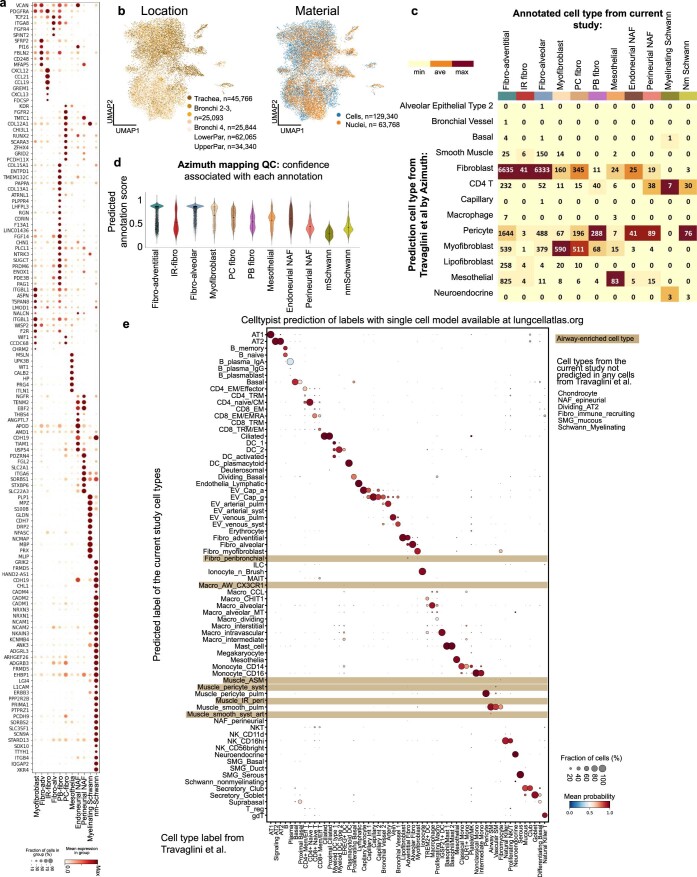
Extended Data Fig. 2. Novel fibroblast subsets.
(a) Dot plot of marker gene expression for indicated cell types. (b) UMAP of location and sequencing material from fibroblasts. (c) Heatmap showing annotated cell types to the predicted labels for fibroblasts from Travaglini et al. (Travaglini et al. 2020) by the Azimuth tool, coloured by proportion. Labels by the proportion of annotated cells and the total number of cells mapping to the reference. (d) Violin plots with predicted annotation score for each of the annotated cell types to the reference. Small dots represent cells, circles represent mean values and bars show standard deviation. (e) Dot plot showing the cell type cross-validation by transferring cell type labels from our single cell dataset (row) to cell types from Travaglini et al. 2020 (column). For each column (each cell type from the Travaglini et al. 2020), size of a dot denotes the proportion of cells assigned to a given cell type in our dataset and colour denotes the average probability. Highlighting marks the airway-enriched cell types.

