

SUMMARY
Successful colonization of a host requires bacterial adaptation through genetic and population changes that are incompletely defined. Using chromosomal barcoding and high-throughput sequencing, we investigate the population dynamics of Streptococcus pneumoniae during infant mouse colonization. Within one day post-inoculation, diversity was reduced >35-fold with expansion of a single clonal lineage. This loss of diversity was not due to immune factors, microbiota or exclusive genetic drift. Rather, bacteriocins induced by the BlpC-quorum sensing pheromone resulted in predation of kin cells. In this intra-strain competition, the subpopulation reaching a quorum likely eliminates others that have yet to activate the blp locus. Additionally, this reduced diversity restricts the number of unique clones that establish colonization during transmission between hosts. Genetic variation in the blp locus was also associated with altered transmissibility in a human population, further underscoring the importance of BlpC in clonal selection and its role as a selfish element.
eTOC Blurb
Aggarwal et al. report evidence of extensive loss of diversity due to intra-strain competition during nasopharyngeal colonization by Streptococcus pneumoniae. Activation of a quorum sensing-induced bactericidal program led to predation of kin cells during within-host colonization as well as tightening of population bottlenecks during transmission between hosts.
Graphical Abstract

INTRODUCTION
An important step in the lifecycle of opportunistic pathogens includes the successful colonization of a host. During this stage, microbes adapt to the host environment by altering their gene expression and subverting host defenses. Competitive success during host colonization, therefore, shapes the ecology of infecting microbes, and influences their pathogenesis and ability to transmit between hosts – impacting their population-wide success1.
While numerous studies have characterized specific factors important for colonization and transmission, little is known about the population dynamics of microbes in vivo2–6. Routinely used readouts such as population size do not provide the molecular resolution required for mechanistic insight into bacterial interactions during initial stages of infection. Technological advances have enabled such investigations through affordable deep-sequencing of chromosomally-barcoded bacteria and allowed for exploration of population bottleneck sizes during disease7–13. However, these methods have not yet been used to study the entire infection lifecycle, and hence there is still little knowledge regarding the processes that shape population structure during colonization and transmission.
Using chromosomally-barcoded bacteria, we investigate the population dynamics of Streptococcus pneumoniae (Spn) during colonization and transmission. Spn is a common nasopharyngeal colonizer and a leading cause of disease following transit to normally sterile host sites. To study its pathogenic lifecycle, an animal model that recapitulates key features of human Spn pathogenesis is critical. Infant mice fulfill this need as they, like young children, exhibit high susceptibility to infection, prolonged colonization duration and enhanced propensity for transmission14,15. Using this animal model to investigate Spn population dynamics during colonization, we demonstrated a rapid loss in diversity of isogenic Spn clones over this period, which consequently impacted population structure during transmission. This loss of diversity was attributable to quorum sensing-dependent expression of bacteriocins, which we propose act selfishly to promote their own success in the Spn population.
RESULTS
Construction of a diverse DNA-barcoded Spn library
To evaluate the population structure of Spn and study the trajectory of multiple clonal lineages during infection, we constructed a DNA-barcoded library of a Spn 23F strain (Figs 1A, S1). A plasmid library containing short nucleotide sequences (barcodes), which tagged each clone with a distinct molecular identity, was transformed into the 23F strain (Fig S1). The resulting Spn 23F library consisted of 2,764 uniquely barcoded clones that are isogenic, differentiated only by the nucleotide sequence of their respective barcodes (Fig S1). The barcode distribution of this Spn library followed a slightly over-dispersed Poisson distribution, with the most abundant clone in the library present at a frequency of 0.65%, suggesting a well-mixed distribution of uniquely barcoded clones. The abundance distribution of these clones remained unchanged upon in vitro passaging confirming stability of the barcoded Spn library (Fig S2A).
Fig 1: Rapid loss of within-host clonal diversity of Spn during nasopharyngeal colonization.

(A) Schematic denoting the workflow of constructing Spn molecularly-barcoded clonal library. (B) Colonization levels of Spn library in retro-tracheal lavages from infant pups over time. Pups were infected at days 3–4 of age. LOD: Limit of Detection. (C-E) Diversity of the Spn library decreases over time as measured by (C) number of unique clones present (P<10−5 by quasipoisson regression), (D) Hill’s N1 diversity coefficient (P<10−5 by Poisson regression), and (E) proportion of the most abundant clone (P=1×10⁻⁴ by quasibinomial regression). P-values were calculated using a generalized linear model, and fitted trend is shown in blue line. (B-E) Each data point represents an individual animal. (F) Illustrative dynamics of top ten barcodes over time. Total height represents measured CFU/ml, and each band shows the proportion of the community made up by the clones, ranked by final frequency. Clone highlighted in blue is the most common barcode in the inoculum while the one highlighted in green is most abundant at 4 weeks.
Rapid loss of Spn clonal diversity during colonization
Next, we investigated how the population structure of Spn changes during colonization in an infant mouse model. Upon inoculation with the Spn 23F library, the bacterial colonization density increased steadily, until reaching carrying capacity 1 day post-inoculation (Fig 1B). Colonization levels remained unchanged for up to 4 weeks. Over 50% of the clones present in the inoculum were successful in establishing colonization as early as 2- and 6 hours post-inoculation (Fig 1C). However, there was a sharp decline in the number of unique clones present during the course of colonization (Fig 1C). At 1 day post-inoculation, only 28.2% of the total clones were recovered from the mice, while the corresponding number at 2 weeks was 4.3%. The clonal diversity, measured by Hill’s N1 coefficient, also decreased rapidly to 2.77% of the inoculum at 1 day post-inoculation (Fig 1D). This diversity continued to decrease over time, with Hill’s N1 decreasing to 0.49% and 0.23% at 2 and 4 weeks, respectively, relative to the inoculum. The mean richness of the most abundant clone in the population increased from 0.65% in the inoculum to 41.6% at 1 day and 74.5% at 4 weeks post-inoculation (Fig 1E, F).
Neither clonal abundance, genetic drift, nor in vivo adaptation explains the observed loss in diversity
We investigated whether success of a given clone during colonization is a function of the abundance of its founder in the inoculum. While the clone that was most abundant in the inoculum was detected in pups at 1 day post-inoculation, it was rare (<5% abundance) in each individual pup, and not detected in any pup at 2 or 4 weeks post-inoculation (Fig 2A). These data suggested that the clonal success of certain lineages was not necessarily a factor of their abundance in the inoculum. The identities of the most abundant clones detected in individual pups at each time points were distinct, as evidence of the barcodes being neutral (Fig S2B).
Fig 2: Random fluctuations, genetic drift and in vivo adaptation are not responsible for the observed loss in diversity.
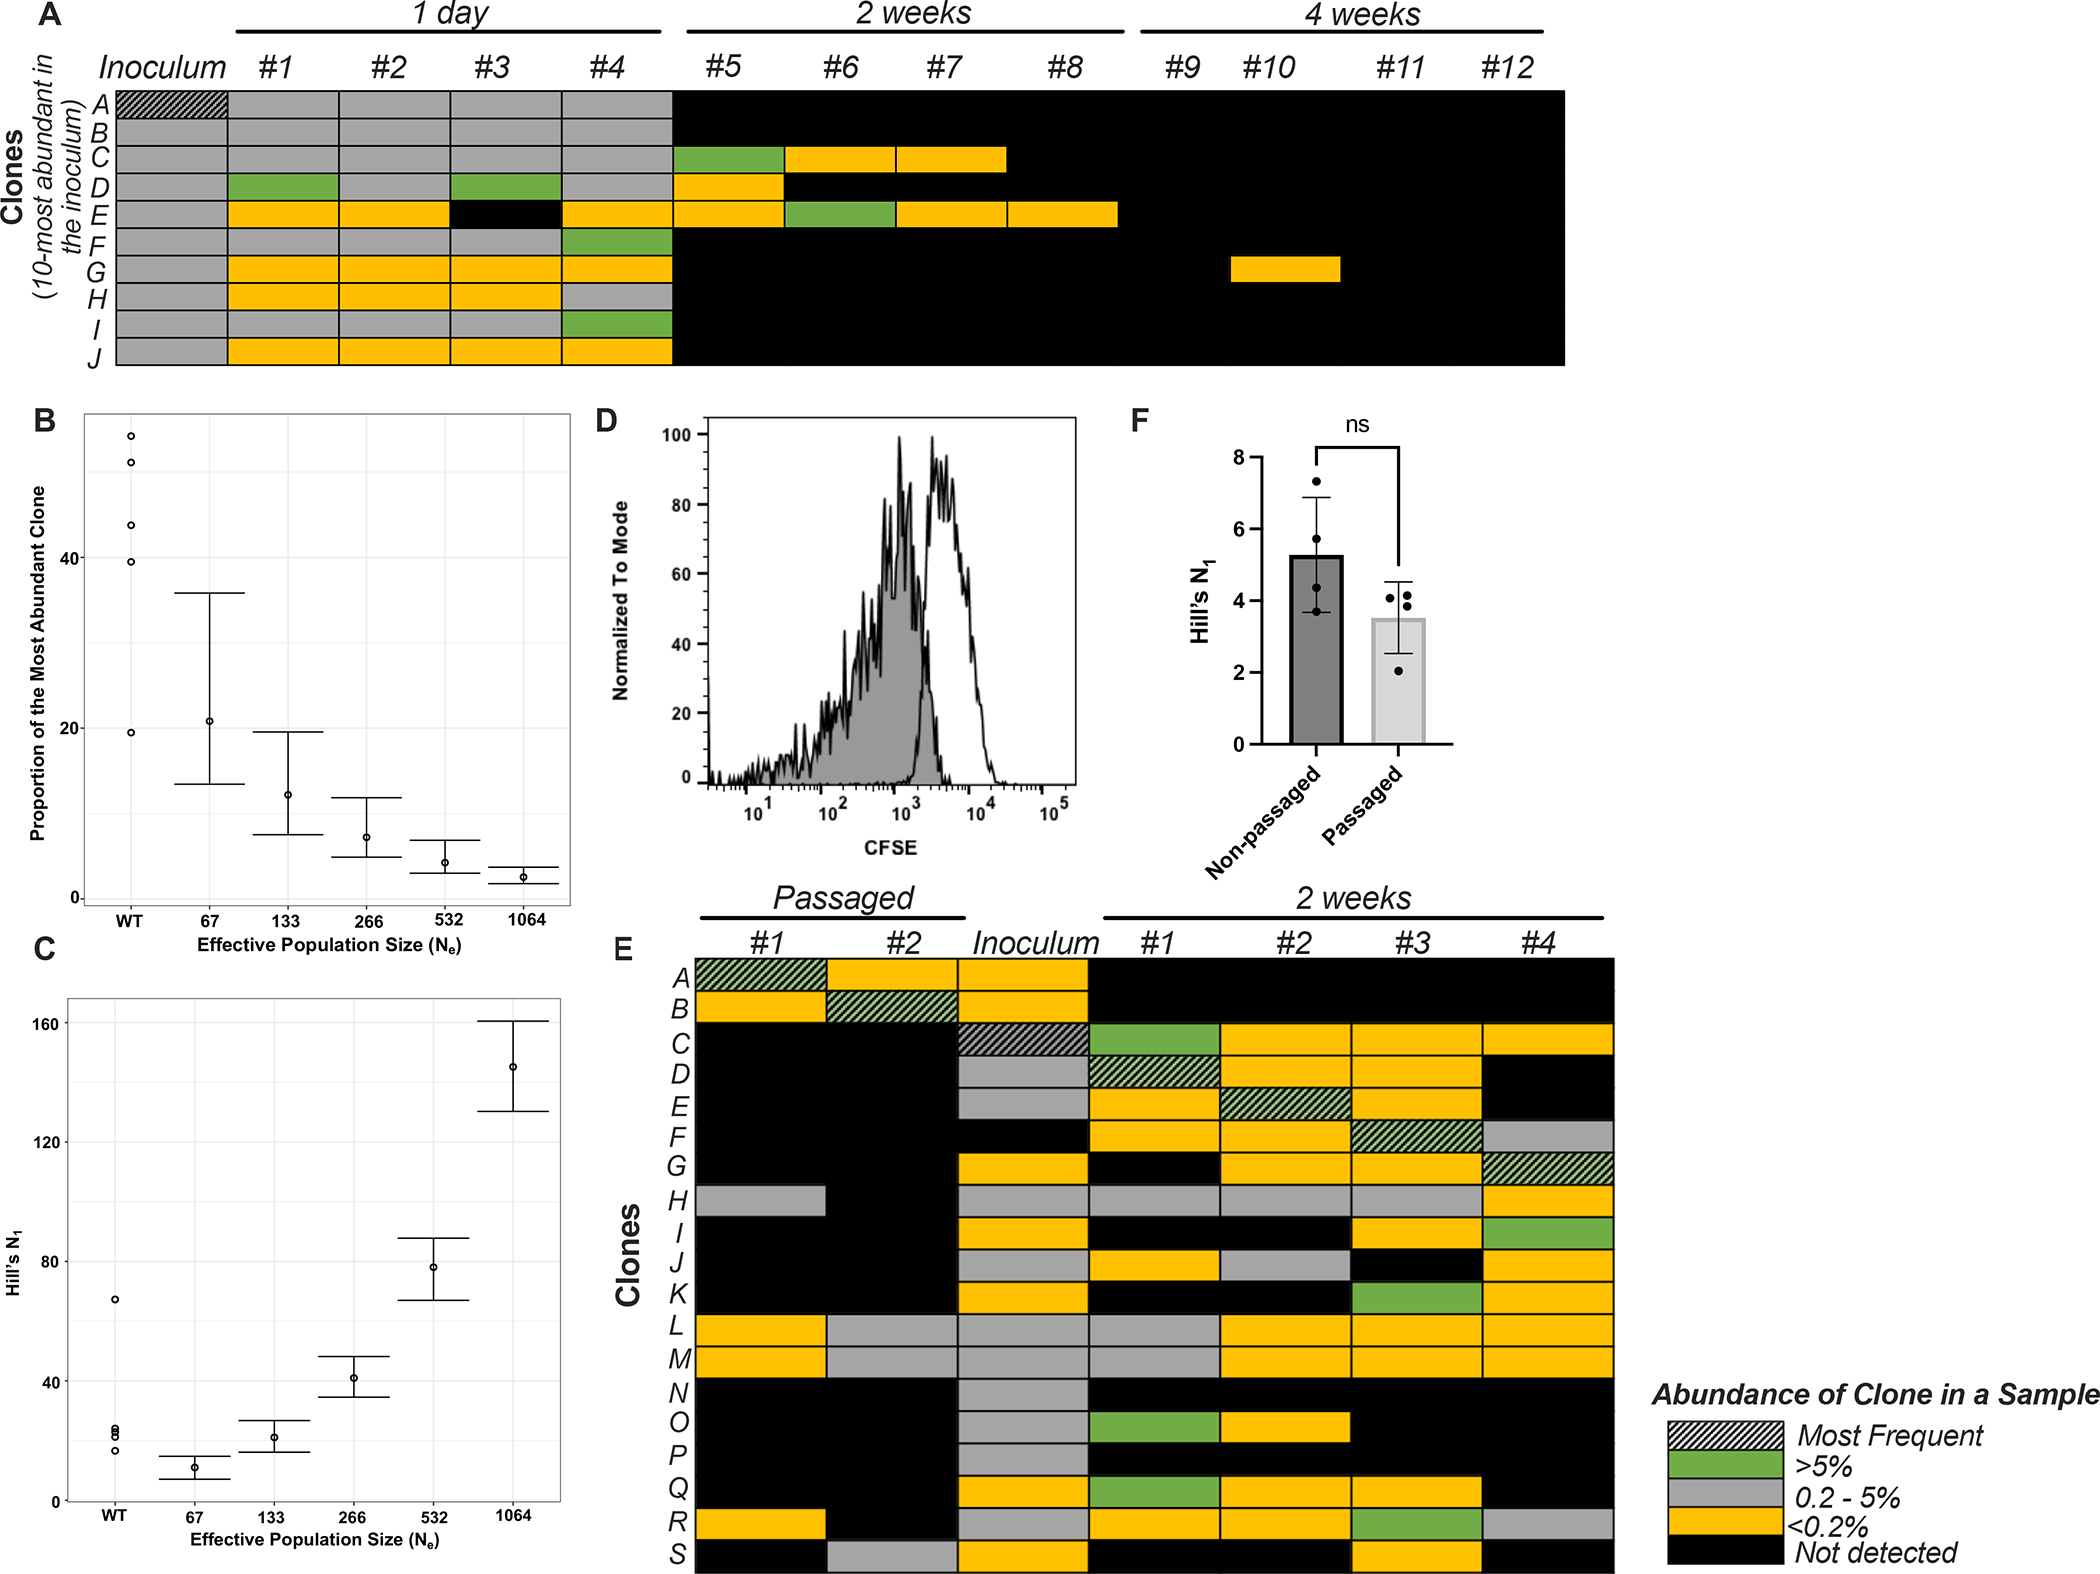
(A) Abundance of the clone in the inoculum is not an indicator of its success during colonization. Heat map denotes the abundance of individual clones belonging to the Spn library either in inoculum and individual infant pups (#1–12) at different time points. The clones selected for visualization were the 10-most abundant clones in the inoculum. The most abundant clone in the inoculum (clone A, hatched) is not detected in the populations found colonizing upper respiratory tract (URT) of pups at 2 and 4 weeks post inoculation. (B, C) Observed loss in diversity during early colonization (1 day post-inoculation) is unlikely to be attributed solely to genetic drift. WT denotes the observed values while the remaining points denote the expected values at different effective population sizes if loss in diversity was solely occurring due to genetic drift. Points show the mean from 300 repeats, and bars the 95% quantile. (D) Flow plot demonstrating a majority of the Spn population replicates in vivo. Blank curve denotes inoculum and the shaded curve represents population recovered at 19 hours post-inoculation. (E, F) In vivo adaptation is not responsible for the observed loss in diversity at 2 weeks post-inoculation. (E) Heat map denotes the abundance of individual clones belonging to the Spn library in the in vivo passaged populations, mixed inoculum and populations recovered from infant pups. Clones A and B that were most abundant in the passaged populations (hatched) were not detected from the URT of mice after 2 weeks following the re-inoculation of passaged populations into the pups. (F) Graph represents Hill’s N1 diversity coefficient when infected with non-passaged and in vivo passaged libraries. Data is presented as mean ± SD. ‘ns’ denotes statistically not significant by Mann-Whitney test.
We then investigated the contribution of genetic drift to the observed loss in diversity during colonization. Using Wright-Fisher simulations, we estimated the baseline expectation of clonal abundance that was influenced only by genetic drift at 1 day post-inoculation. The contribution of genetic drift depends on the dynamics of the actively replicating population, or effective population size, Ne. Previous work has calculated a fairly low point estimate of 133 for Ne of Spn during nasal carriage in adult mice16. By modeling the experimental data obtained at 6 hours post-inoculation and at this low Ne, the expected frequency of the most abundant clone and the Hill’s N1 values are significantly different than the observed values (Figs 2B, C). Given their higher carrying capacity of colonizing Spn, we postulated that infants may allow for larger Ne values relative to adult mice15,17. We used a previously described carboxyfluorescein diacetate succinimidyl ester (CFSE) dilution assay to determine what proportion of Spn are undergoing replication in vivo18,19. We observed a pronounced reduction in the fluorescence intensity of CFSE among colonizing Spn at 19 hours post-inoculation, suggesting that a vast majority of cells have undergone division (Figs 2D, S3). 95.3% of the cells (105 CFU/ml) present in the colonizing population had undergone at least one division by this time point. These data indicate that the Ne of Spn colonizing infant mice during these early time points may be significantly larger than 133. Combined, these data indicated that genetic drift alone was not the sole cause of lost diversity during colonization.
To test the possibility that in vivo adaptation of clones is responsible for their success, we challenged pups with previously animal-passaged Spn libraries that were mostly dominated by single clones (~95% and ~99% abundance at 4 weeks, Fig 1E). Before inoculation, these animal-passaged populations were mixed with a non-passaged Spn library so that the overall abundance of the most abundant clones from the passaged populations was equivalent to the median abundance of clones in the non-passaged library. Of note, two weeks after this mixed library inoculation, the most abundant clones in these pups originated from the non-passaged library, not the previously in vivo-passaged populations (Fig 2E). Further, the diversity of the non-passaged and passaged libraries at 2 weeks was not statistically different (Fig 2F). These data excluded the possibility that mutations arose during in vivo passaging that conferred a fitness advantage to a particular clone.
Host factors and co-infection do not contribute to loss of diversity during colonization
To explain the observed changes in population structure, our population genetics calculations allowed for two possibilities – either the most abundant clone replicated at a rate about twice as fast as other clones in the population, or was cleared at a rate approximately two-times slower (Fig S4).
Innate (TLR2 and IL-1 signaling) and adaptive (IL-17 signaling) immune factors have previously been shown to influence persistence by aiding in clearance of colonizing Spn20–23. We tested whether these factors also influenced the population structure of Spn at 4 weeks post-inoculation. There was no change observed in the diversity of colonizing Spn in either Tlr2−/−, Il1r−/− or Il17ra−/− mice (Figs 3A–C). The increased persistence of Spn was evident in Il17ra−/− mice even at 4 weeks post-inoculation (Fig 3D).
Fig 3: Host factors do not contribute to the observed loss of diversity.

(A-D) Signaling by innate and adaptive immune factors (A) TLR2, (B) IL1R, and (C) IL17Ra that contribute to Spn clearance do not aid in loss of diversity at 4 weeks post inoculation. (D) Corresponding Spn colonization levels in retro-tracheal lavages from WT, Tlr2−/−, Il1r−/−, and Il17ra−/− infant pups. P-values were calculated by Kruskal-Wallis test followed by Dunn’s correction for multiple comparisons. (E, F) Age has no effect on influencing Spn clonal diversity. Comparison of (E) Hill’s N1 diversity coefficient, and (F) colonization levels in infants and adults at 1 day and 2 weeks post-inoculation. P-values were calculated by 2-way ANOVA followed by Tukey’s multiple comparison test. (G, H) Depletion of host microbiota by streptomycin treatment did not influence Spn (G) Hill’s N1 diversity coefficient, or (H) colonization levels. (I, J) Influenza A virus (IAV) co-infection does not alter Spn population structure. Comparison of (I) Hill’s N1 diversity coefficient, and (J) Spn colonization levels in IAV co-infected pups relative to mock treatment group 10 days following Spn infection. P-values were calculated by Student’s t-test. All graphs are presented as mean ± SD.
Age of the mice also did not influence the population structure of the colonizing Spn population. Similar to that in infant mice, we also observed a rapid loss of clonal diversity in adult mice (Fig 3E). As expected, Spn colonized infant mice at a higher density relative to adult mice (Fig 3F). These data also showed that increased colonization density did not correlate with higher diversity.
We investigated the hypothesis that prior occupation of the host niche by its resident microbiota restricts colonization by Spn and in turn, limits clonal diversity. The resident microbial community was disrupted by treating adult mice with streptomycin, previously shown to deplete the upper respiratory tract microbiota24. Depletion of resident microbiota by streptomycin treatment did not significantly alter the colonization density or the clonal diversity of Spn (Figs 3G, H). While co-infection with influenza A virus (IAV) increased Spn colonization levels, such co-infection similarly had a negligible effect on diversity (Fig 3I, J).
BlpC-mediated signaling is responsible for loss in Spn diversity during colonization
We then investigated if the observed decrease in diversity could be attributed to a bacterial factor. Given that all colonizing Spn were isogenic, differing only by unique barcodes, we postulated that quorum sensing-induced transcriptional variations in the colonizing population may affect population structure. Previous work has demonstrated that competence-induced activation of fratricidal molecules allows earlier colonizing bacteria to competitively exclude later arriving isogenic bacteria24. We tested whether these fratricidal molecules (CibAB and CbpD) were also responsible for altering the Spn population structure during colonization by constructing a diverse ΔcibABΔcbpD barcoded-library (Fig S1C). No difference was observed in either the colonization density or clonal diversity of WT versus ΔcibABΔcbpD strains 1 day post-inoculation (Figs 4A, B). Thus, these fratricidal molecules that are important for in vivo competition during early hours following colonization19,24, do not lead to the observed decrease in diversity of Spn.
Fig 4: BlpC-mediated signaling results in the Spn loss of diversity during colonization.

(A, B) Fratricidal molecules CibAB and CbpD do not alter Spn population structure. Graphs depicting (A) Hill’s N1 diversity coefficient, and (B) colonization levels of WT and ΔcibABΔcbpD strains 1 day post-inoculation. (C-G) BlpC-mediated signaling contributes to loss of clonal diversity. Graphs depicting (C) Hill’s N1 diversity coefficient, and (D) colonization levels of WT, Δblp locus, and ΔblpC strains 1 day post-inoculation. P-values were calculated by ANOVA followed by Tukey’s multiple comparison test. (E) Population structure depicted by comparing proportion of the most abundant clone in WT and ΔblpC strains 1 day post-inoculation. (F, G) Changed population structure of ΔblpC strain is sustained 4 weeks post-inoculation. Graphs depicting (F) Hill’s N1 diversity coefficient, and (G) colonization levels of WT and ΔblpC strains at 4 weeks post-inoculation. The 1 day data is re-plotted for illustration. P-values were calculated by Student’s t-test. (H, I) Contribution of genetic drift in reducing clonal diversity of ΔblpC strain cannot be ruled out. Comparison of expected and observed proportion of the most abundant clone 1 day post-inoculation for the ΔblpC strain. ΔblpC denotes the observed value, while the remaining points denote expected values at different effective population sizes. Points show the mean from 300 repeats, and bars the 95% quantile. (J) Graph denotes median of competitive index (CI) values between competing strains from individual pups 2 weeks post-inoculation. CI was calculated as the ratio of strains recovered from infant pups relative to that in the inoculum. No difference in the CI when either 23F WT or Δblp strain were competing against the T4 WT by Student’s t-test. The CI were also compared to a median hypothetical value of 1 (indicating no competition) using Wilcoxon test. “ns” denotes statistically not significant. Data is presented as mean ± SD.
Competitive interactions in vivo are thought to be mediated at least in part by the action of bacteriocin peptides that can kill or inhibit the growth of other bacteria. The Spn genome encodes numerous putative bacteriocin gene clusters, some of which are activated downstream of quorum sensing pathways25,26. Of these, the Blp family of bacteriocins facilitates competition between different Spn strains27–31. We investigated whether the bactericidal activity encoded by molecules of the blp locus was responsible for loss in Spn clonal diversity using a sufficiently diverse Δblp library (Fig S1D). There was approximately a fivefold increase in the clonal diversity of Δblp compared to the WT strain 1 day post-inoculation with no change in the colonization levels (Figs 4C, D). These results suggested that the blp locus facilitated not just inter-strain but also intra-strain killing, and was responsible for decreasing the Spn clonal diversity in vivo.
The blp locus is induced by signaling via the peptide pheromone encoded by blpC27. We, therefore, tested whether loss of BlpC-mediated signaling was sufficient to observe the restoration of clonal diversity as observed in the Δblp strain. There was no change in the colonization density when inoculated with diversely barcoded ΔblpC strain (Figs 4D, S1E). As with Δblp strain, we observed a similar increase in the clonal diversity when infected with ΔblpC relative to the WT strain at 1 day post-inoculation (Fig 4C). There was a marked change in the abundance distribution of the clones as well. While the most abundant WT clone was present a frequency of 41.6%, the corresponding frequency for the ΔblpC clone was 18.7% 1 day post-inoculation (Fig 4E). These results suggested that the activation of BlpC-mediated signaling in a clone conferred a competitive advantage at the expense of its kin following infection. Additionally, they suggested that BlpC activates a “selfish” program that works to ensure clonal lineage survival leading to the genetic element’s own success within the population. The increased Spn diversity when colonized by ΔblpC strain was sustained over time as evidenced by approximately threefold increase in diversity over WT strain 4 weeks post-inoculation but no change in colonization levels (Figs 4F, G).
In regards to the remaining loss of diversity of the ΔblpC strain, we cannot rule out the contribution of genetic drift in influencing the population structure (Fig 4H, I). To account for the contribution of genetic drift alone, we also estimated the Ne by fitting the model to our observed diversity data. The estimated Ne for the ΔblpC strain (point estimate: 790; 95% Credible Interval (CrI) = 620–900) was much higher than that for the WT strain (point estimate: 33; 95% CrI = 6–76). These data indicate that BlpC-mediated signaling significantly restricts the Ne, and increases the influence of genetic drift in altering Spn population dynamics.
Next, we evaluated the contribution of Blp bacteriocins to inter- and intra-strain competition. When two Spn strains are co-inoculated into the same mouse in a murine colonization model, the 23F strain used in this work outcompeted another commonly used strain, TIGR419. It is worth noting that there is no inherent difference in the colonization capacity of these strains when inoculated individually (Fig S5). In the co-inoculation scenario, the blp locus was not responsible for the inter-strain competitive advantage of the 23F strain, as both WT and Δblp strains performed similarly in competition with TIGR4 (Fig 4J). However, when WT and Δblp strains both belonging to the 23F genomic background were tested against each other in a competitive infection, the Δblp strain outcompeted the WT strain (Fig 4J). This intra-strain competition that resulted in the killing of the blp+ population suggested there was a fitness cost associated with expression of the blp locus. The conservation of a selfish genetic element is inherently intertwined with the host organism’s own success in the population. Accordingly, the expression of blp locus ensures its propagation in the population via Spn clonal expansion at the expense of isogenic kin (Figs 1E, 4E). Together, these results implicate the selfish nature of the blp locus.
Tight bottlenecks limit Spn transmission during both acquisition and establishment of colonization
Next, we questioned the implication of altered population structure during colonization for another important aspect of Spn lifecycle – transmission which can be divided into the steps of acquisition by a new host and establishment of colonization. The sequencing of a chromosomally-barcoded Spn library provided us with the molecular resolution to answer this question. During transmission, only 11.3% of Spn clones present in inoculated index pups transmitted to littermate contact pups, highlighting a population bottleneck during the acquisition stage of transmission (Fig 5A). The Spn population acquired by the contact pups exhibited significantly reduced clonal diversity relative to index pups (Fig 5B). There was no change in colonization levels between index and contact pups that acquired Spn (Fig 5C). While the frequency of the most abundant clone in the index pups was about 23%, it increased to 75.3% in the contact pups with a different clone succeeding in each pup (Figs 5D, E).
Fig 5: BlpC-mediated signaling reduces the transmissibility of clones.

(A-D) Diversity of Spn library is significantly reduced in contact pups relative to index pups. Diversity is depicted as (A) number of unique clones, (B) Hill’s N1 diversity coefficient, and (D) proportion of the most abundant clone. (C) Graph denotes Spn colonization levels in index and contact pups. P-values were calculated by Student’s t-test. (E) Abundance of clone in the index pup is not necessarily an indicator of its success in establishing colonization in the contact pups. Figure depicts percentage abundance of four clones (A-D) in index and contact pups. Clones were chosen for visualization since these were the most abundant clones in individual contact pups. (F) Colonization levels of WT and ΔblpC strains in contact pups. (G) Graph denotes the percentage of clones of WT and ΔblpC strains transmitted from index to contact. P-values were calculated by Student’s t-test. Data is presented as mean ± SD.
Following acquisition, not all clones were equally successful in establishing colonization in the contact pups. Spn population in the contact pups was dominated by a single clone, pointing towards the existence of another population bottleneck during this stage of transmission. In some cases, clones that were most abundant in the contact pups were present in the index pups at very low frequencies (<0.5%). Our results show that in addition to reduction of clonal diversity during colonization, the clonal pool available for spread within the host population is further restricted both during acquisition and establishment of Spn in a new host. We also attempted to fit bottleneck size to the observed diversity data from our transmission model, obtaining a size of 9 (95% CrI = 1–62), consistent with a bottleneck lower than the fitted Ne = 636 for this model, but less than the observed loss of diversity. However, we note that our estimate had a wide credible interval, in part due to uncertainty at which time during the experiment transmission actually occurred.
Contribution of the blp locus to clonal transmission dynamics
Loss of clonal diversity during transmission among infant mice also suggested the possibility of a blp-mediated effect on transmission success. With this observation in mind, we then evaluated whether data collected from the human population would support a role of bacteriocins in transmission. We used whole-genome sequence data collected from carriage episodes of unvaccinated mother-child pairs, which has previously been used to identify genetic variation associated with penicillin resistance and carriage duration32. After adjusting for multiple testing across the genome, transmissibility of Spn was associated with genetic variations in the blp locus (Table 1). Although these results were noisy due to the strong correlation between genetic background and phenotype, at least one significant association was found in each blp gene. The correlation with genetic background means that this result could be explained by the direct effects of acquired variation within the blp locus on transmission rate by conferring fitness advantage for between-host success, or, alternatively could be explained by lineage effects whereby certain blp alleles are associated with successfully transmitting clones. In the latter scenario blp alleles do not have a direct causal effect on transmissibility.
Table 1: Top variants in the blp genes associated with Spn transmissibility.
Table lists top variants in the blp genes along with the corresponding nucleotide mutations associated with Spn transmissibility. Asterix denotes that mutations are mapped to the annotated D39V reference genome.
| Gene | Mutation in D39V* | P-value |
|---|---|---|
| blpT | 476989C->T | 9.33E-08 |
| blpS | 477733G->A | 3.57E-14 |
| blpR | 477991T->A | 3.10E-17 |
| blpH | 478981C->T | 9.62E-24 |
| blpC | 479981G->A | 2.96E-16 |
| blpY | 484613C->A | 1.65E-20 |
| blpZ | 485001T->C | 1.24E-19 |
To directly investigate whether BlpC-mediated signaling played a role in influencing clonal success during transmission, we interrogated how loss of this signaling impacted Spn transmission in our murine model, which uses IAV co-infection. Loss of blpC did not influence Spn transmissibility in the mouse model (Fig 5F). In agreement, the loss of the gene also did not influence transmission efficiency of Spn (Fig S6), ruling out a direct causal effect of blpC on transmission in our model. However, there was over a fivefold increase in the percentage of clones acquired by contact pups in the case of ΔblpC infection compared to WT Spn (Fig 5G). Thus, BlpC-mediated bactericidal activity contributes to population bottlenecks during transmission and colonization. Our data show that an important role of BlpC-mediated bactericidal activity is to limit the pool of clones successfully transmitted to new hosts.
Together, our results highlight the selfish nature of the blp locus as it functions to decrease within-host clonal diversity to drive lineage success during transmission to a new host. Applying this principal to carriage dynamics could explain our observation of excess of some blp alleles in successful lineages.
DISCUSSION
An unexplored facet of infection biology is the study of in vivo population dynamics that is fundamental for gaining mechanistic insight into bacterial interactions within a host. Here, we investigated this question by focusing on the ecology of colonizing Spn. We demonstrate that Spn exhibits a rapid loss of clonal diversity early during colonization that results in the eventual domination of the population by a single clonal lineage. Interestingly, the expansion of this clonal lineage was not due to any potential mutations acquired during in vivo passaging since re-challenging of these passaged clones neither conferred any colonization advantage nor influenced clonal success in a new host. Our work highlights the non-genetic individuality displayed by isogenic Spn population in vivo, and how this phenotypic variability results in intra-strain competition by predation of kin cells.
Studies such as omics screens that are aimed at identification of genes important for bacterial colonization and pathogenesis are often noisy. Such screens are typically based on assumptions that the structure of colonizing bacterial populations is homogenous (e.g., for bulk RNA-seq) and that observed changes in the frequency of a mutant must be due to selection (e.g., for transposon mutagenesis). However, our results contradict both assumptions by providing evidence of genetic heterogeneity and tight bottlenecks in the colonizing population, as over 70% of the inoculated population was cleared by 1 day post-inoculation. This work highlights the need to account for the effects of intra-strain competition when designing such screens.
While fratricidal effector molecules CibAB and CbpD are important for in vivo competition within the first 6 hours following colonization24, our work shows that they do not influence clonal diversity of co-colonizing isogenic Spn. We speculate that differences in spatiotemporal activation of these molecules could limit the role they play in mediating intra-strain competition during infection.
Bacterial cells exhibit remarkable spatially resolved transcriptomic heterogeneity during biofilm growth and in vivo that can be partly attributed to quorum sensing33,34. The BlpC pheromone is an important quorum sensing peptide encoded by Spn that signals via BlpHR to exclusively induce genes encoded by the blp system27. Activation of BlpC-mediated signaling resulted in the early dominance of a single clone during colonization. One possibility is that following infection, clones that are first to activate the Blp quorum sensing via inferring local cell density produce bacteriocins and associated immunity proteins. These bacteriocins result in the killing of the neighboring kin cells that have not yet induced the expression of their Blp immunity proteins. Alternatively, stochasticity in bacteriocin-mediated killing during early colonization could increase the representation of a given clone, providing a feedforward advantage.
The blp locus, which is under negative frequency-dependent selection, is one of the most heterogenous regions in the Spn genome35,36. Our results demonstrate that it is not just differences in the possession of cognate immunity proteins but the spatiotemporal dynamics of Blp activation that leads to decreased Spn diversity and increased clonal dominance in a ‘winner takes all’ regime.
These results are striking because they establish that the function of blp locus extends beyond inter-strain to intra-strain killing as well. BlpC signaling-mediated killing of isogenic kin results in restricting the Ne, thereby increasing the influence of genetic drift in shaping the population structure. While bacteriocin-mediated killing of neighboring bacteria increases the amount of free DNA available for uptake by transformation, this may also be detrimental to the bacterial population by increasing the probability of deleterious alleles being fixed in the population. Further, even though the expression of blp locus is costly to the cell during competitive interactions in vivo, it results in expansion of individual clonal lineages that can ensure the genetic element’s success in the population. This paradox can be explained by considering BlpC-mediated signaling as a selfish program.
Another important aspect of Spn lifecycle that is important for its epidemiological success within the host population is the transmission of bacteria between hosts. While there is no stringent bottleneck during the shedding stage15, we show that population bottlenecks exist at the acquisition and colonization stages that limit Spn transmission between hosts. Of note, the increased abundance of a clone in the index mouse was not necessarily an indicator of its success during transmission. Our results demonstrate that BlpC-mediated signaling not only limits the pool of clones that are available for transmission, but also restricts their success during spread within the host population. Thus, BlpC-mediated bactericidal activity influences success of a clone both within- and between-hosts.
Analysis of Spn isolates recovered from natural human transmission reveal positive associations between genomic variation in the blp locus and increased Spn transmissibility. We posit that blp locus is a determining factor in lineage-dependent success and this is primarily due to intra- rather than inter-strain predation. Genes from the blp locus were also found to be frequently mutated during nasopharyngeal carriage in infants37. The sustained selective pressure during both colonization and transmission could explain the high genomic heterogeneity of the blp locus.
Thus, our findings demonstrate that the rapid loss of clonal diversity observed during Spn colonization and transmission is due to a selfish program activated by BlpC. While our current study was focused on Spn, we hypothesize that other bacteria may employ similar bet-hedging strategies during infection. It is now increasingly appreciated that various bacterial species routinely employ intra- and inter-strain predation to perpetuate their own survival38–42. Both quorum sensing and bacteriocin production are behaviors commonly exhibited by microbes. It remains to be investigated how the bactericidal molecules encoded by other bacteria also play a role in determining their clonal success in vivo.
STAR METHODS
RESOURCE AVAILABILITY
Lead contact
Further information and requests for resources and reagents should be directed to and will be fulfilled by the lead contact, Jeffrey N. Weiser (Jeffrey.Weiser@nyulangone.org)
Materials availability
All unique reagents generated in the study are available from the lead contact with a completed Materials Transfer Agreement.
Data and Code availability
All data reported in this paper will be shared by the lead contact upon request.
The code for analyzing the sequencing data is available at https://github.com/sda26/pneumo_diversity. The code for running population genetic simulations, fitting to data, and fitting generalized linear models is available at https://github.com/johnlees/transmission_blp (version 1.0, Apache 2.0 license).
Any additional information required to reanalyze the data reported in this work paper is available from the Lead Contact upon request.
EXPERIMENAL MODEL AND SUBJECT DETAILS
Ethics statement
All animal experiments were performed according to the guidelines laid by National Science Foundation Animal Welfare Act (AWA) and the Public Health Service Policy on the Humane Care and Use of Laboratory Animals. NYU’s Grossman School of Medicine’s Institutional Animal Care and Use Committee (IACUC) oversees the welfare, well-being, proper care, and use of all animals. They have approved the protocols used in this study: IA16-00538 and IA16-00435.
Bacterial strains and growth conditions
Spn 23F strain, P2499, was used in experimental work unless otherwise indicated. P2499 is a streptomycin-resistant derivative of P1121, an ST33 strain obtained from a study of experimental human Spn colonization, and previously tested to colonize mice efficiently14,24,43–45. A mutant lacking the fratricidal genes (ΔcibABΔcbpD, P2576; kanamycin-resistant) was also used in this work24. A streptomycin-resistant derivative of TIGR4, P2406, was used for competition experiments14. All bacterial strains used in this experimental work are listed in Table S1. Colonies were grown from frozen stocks by streaking on TSA-II agar plates supplemented with 5% sheep blood (BD BBL, NJ, USA). Unless otherwise stated, starter cultures were prepared by inoculating streaked colonies in tryptic soy (TS) broth statically at 37°C until they reached an optical density at 620 nm (OD620) of 1.0. The cells were then pelleted, washed and resuspended in sterile phosphate-buffered saline (PBS) for mouse inoculations. Bacterial numbers were enumerated by plating serial dilutions on TSA plates supplemented with 100 μl of catalase (38,000 U/ml; Worthington Biochemical Corporation, NJ) and the desired antibiotic (250 μg/ml kanamycin, 200 μg/ml streptomycin, or 200 μg/ml spectinomycin) and incubated overnight at 37°C with 5% CO2.
Animal studies
Wild-type C57BL/6J (strain 00664), congenic Tlr2−/− (strain 004650), and Ilr1−/− (strain 003245) mice were purchased from The Jackson Laboratory (Bar Harbor, ME). Il17ra−/− mice were obtained from Amgen (Thousand Oaks, CA). Each of these mouse colonies was bred and maintained in a conventional mouse facility. Infant pups were housed with the dam until weaning at 3 weeks of age. Following infection, all mice appeared healthy, showed normal activity, and gained weight similarly compared to uninfected controls. Weaned (and adult) mice were fed ad lib the PicoLab Rodent Diet 20, a 20% protein diet formulation, and were given water for consumption. All the animals were kept on a light-cycle of 12 hours on, 12 hours off with a temperature in the animal facility of 70°F (±2°F).
Infant and adult colonization model
Three to four day old infant pups were inoculated intranasally with 105 CFU of Spn in 3 μl of sterile PBS with a pipette tip, without anesthesia. The pups were returned to their dam for the duration of the experiment. The high dose of Spn was used to avoid potentially imposing a population bottleneck during inoculation. For intranasal inoculation of adult mice (6–8 weeks of age, 8 males and 8 females), 105 CFU of Spn was instilled in 10 ul of sterile PBS. Both male and female mice were used in the studies. For host microbiota depletion, adult mice were fed with 500 mg/l streptomycin in drinking water for consumption ad libitum. This antibiotic treatment was started three days prior to Spn infection and was continued for the duration of the experiment. For co-infection with influenza A virus (IAV), mice were inoculated with 250 pfu of IAV/HKx31 in 3 μl of PBS four days after Spn infection. At the end of the experiments, mice were euthanized at the indicated time point by CO2 asphyxiation followed by cardiac puncture. The Spn colonization density of the upper respiratory tract was measured as previously described46. Briefly, the trachea was lavaged using a 30-gauge needle for infants (26-gauge for adults) with 300 μl of sterile PBS collected from the nares. 40 μl of this retrotracheal lavage was used to enumerate bacteria by viable plating serial dilutions on TSA-catalase plates supplemented with the appropriate antibiotic (250 μg/ml kanamycin, 200 μg/ml streptomycin, or 200 μg/ml spectinomycin) and incubated overnight at 37°C with 5% CO2. The remaining lavage was grown in TS broth supplemented with 200 μg/ml spectinomycin at 37°C until it reached an OD620 of 1.0 for genomic DNA isolation.
Transmission model
Transmission studies were carried out in infant pups as previously described46. Briefly, one four day-pup per litter (or “index” pup) was intranasally inoculated with 105 CFU of Spn in 3 μl of sterile PBS and returned to the litter. The ratio of index to uninfected “contact” pups per litter was 1:3 or 1:4. Four days after Spn inoculation, both the index and contact pups were infected with 250 pfu of IAV/HKx31 in 3 μl of PBS. Then, 5–6 days post-IAV infection (9–10 days after Spn infection), all pups were euthanized and the bacterial density in the URT of these pups was quantified by viable plating. Transmission was evaluated by testing whether contact pups showed Spn colonization.
METHOD DETAILS
Construction of mutants
Spn mutants were constructed as previously described19,47,48. Colonies were picked and inoculated in acidic Columbia broth (pH 6.6) and grown until an OD595 of 0.05 followed by the addition of 5 μg/ml of 1:1 mix of CSP1 and CSP2 along with 500 ng of transforming DNA. Cultures were incubated statically at 37°C with 5% CO2 followed by plating on TSA plates supplemented with 100 μl of catalase (38,000 U/ml; Worthington Biochemical Corporation, NJ) and the desired antibiotic (250 μg/ml kanamycin or 200 μg/ml streptomycin). Site-directed homologous recombination was used to create the clean deletion strains, Δblp locus (P2706) and ΔblpC (P2646). These mutants were created in a two-step process. In the first step, the blp locus (or the blpC gene) were replaced with a Janus cassette (containing ~1kb in flanking regions both upstream and downstream of the region of interest) in P2499 to obtain blp::Janus (P2700) and blpC::Janus (P2644) constructs. Both P2700 and P2644 were kanamycin resistant. Thereafter, unmarked, clean deletions were made by replacement of the Janus cassette as previously described24,49. P2700 and P2644 were transformed with PCR fragments containing ~1kb each upstream and downstream of the regions of interest joined together to obtain P2706 and P2646, respectively. The desired mutants were streptomycin resistant but kanamycin sensitive. Mutants were confirmed by PCR following each step. All the primers used in this work are listed in Table S2.
Construction of barcoded library
To construct a DNA-barcoded Spn library, the designed barcodes were first inserted into a pE539 plasmid vector and cloned into Escherichia coli. We designed 7-nt barcodes of the sequence NNMCAATGNNMCAAN, with intervening fixed sequences designed to avoid the presence of start and stop codons. The plasmid pE539 is a derivative of pHSG399 containing a spectinomycin resistance cassette flanked by regions having homology to the S. pneumoniae IgA1 protease gene iga. The IgA1 protease cleaves human, but not murine, IgA, and so disruption has no known impact on bacterial fitness in mice50. The barcodes were inserted immediately upstream of the spectinomycin resistance cassette and in the disrupted iga gene. The synthesized oligos containing the barcodes were inserted into the plasmid vector by isothermal assembly at 50°C for 1 hour. The assembled plasmid pool was transformed into 5-alpha competent E. coli (New England Biolabs, MA) and the transformants were selected by plating on Luria broth (LB) agar plates supplemented with 200 μg/ml spectinomycin. Using this approach, we obtained 3,725 uniquely barcoded E. coli cells with the most abundant clone present at a frequency of 0.16% (Fig S1). The transformed E. coli cells were then grown to isolate the pooled plasmid library by using a Plasmid Midi kit (Qiagen, Germantown, MD) as per manufacturer’s instructions. The transformed E. coli library served as a reservoir for uniquely barcoded-plasmids and was stocked at −80°C. The pooled plasmid library was then transformed into Spn strains using the protocol described above. The barcoded Spn transformants were selected on TS plates supplemented with 100 μl of catalase (38,000 U/ml; Worthington Biochemical Corporation, NJ) and 200 μg/ml spectinomycin. The resulting barcoded Spn library was grown, sequenced and stocked at −80°C.
Library sequencing
Genomic DNA from the samples was isolated using MasterPure Complete DNA & RNA Purification Kit (Lucigen, Middleton, WI) as per manufacturer’s instructions. Barcodes were amplified from genomic DNA using Nested PCR; wherein, the first step consisted of amplifying the iga region (5 cycles) followed by amplification of the barcodes (35 cycles). Primers used for amplification of the barcodes contained the adapters to be used for sequencing library preparation. These amplicons were then purified using QIAquick PCR purification kit (Qiagen, Germantown, MD) as per manufacturer’s instructions. Purified samples were then shipped to Azenta Life Sciences (South Plainfield, NJ) for sequencing using their Next-Gen Amplicon-EZ service.
Analysis of sequencing data
Reads were aligned to a reference sequence using Python. First, trimmomatic was used for quality control to trim adaptor sequences and low-quality bases from the reads (sliding window size: 3, sliding window quality: 20, leading and trailing quality: 15, minimum length: 75) 51. The reads were then aligned to a reference sequence by BWA (Matching Score: 10, Mismatch Penalty: 2) and outputted in a .sam file52. The remainder of the analysis was done using R. The barcode sequence was extracted from the aligned reads by concatenating bases at known variable positions while filtering out incomplete or ambiguous barcodes. A table detailing each barcode detected and the number of times it was found was compiled. To account for variability in the number of total reads, we standardized samples by computing rarefaction and extrapolation of clonal diversity using iNEXT53,54. The clonal diversity was expressed using Hill numbers with q=0 (‘clonal richness’ or number of unique clones present) and q=1 (Hill’s N1)54. Shannon diversity index (H) was calculated as where pi denotes the proportion of the population made up of the clone i.
Genetic drift estimations
Experimental data observed from pups sacrificed at 6 hours post-inoculation was modelled to investigate whether genetic drift was solely responsible for changes in the population structure observed at 1-day post-inoculation. We performed Wright-Fisher simulations to simulate genetic drift, which allowed us to calculate complex diversity indices, use the empirical starting frequencies in the inoculum to account for founder effects and include stochasticity. The members of each subsequent generation is drawn from a multinomial distribution with probabilities set equal to the frequency in the current generation, such that every clone has equal fitness and a single parent. All generations are of equal size (the effective population size Ne). At each generation, we calculated the number of unique clones, the maximum abundance of any clone, and the Hill’s N1 diversity. Using median colonization levels at 2- and 6 hours post-inoculation, an in vivo doubling time of 180 mins was used for calculations. This doubling time amounted to 6 cycles of division between 6 hours and 1 day post-inoculation. For the transmission model, we introduced an extra sample down to the bottleneck size halfway through the simulation, followed by a return to the effective population size.
To fit this model to our experimental data we used sequential approximate Bayesian computation, using Beaumont’s adaptive algorithm55. We used the Hill’s N1 diversity index and maximum abundance as summary statistics, and uniform priors on the effective population size (between 1 and 2000) and the bottleneck size (between 1 and fitted Ne).
CFSE assay
The assay was performed as previously described19. Briefly, Spn grown to an OD620 of 1.0 were resuspended in 1 ml PBS containing 1% catalase and 10 μM carboxyfluorescein diacetate succinimidyl ester dye (CFSE, Invitrogen, Waltham, MA) and incubated at 37°C for 25 mins. Cells were then washed three times with PBS to remove excess dye. Mice were then inoculated with 107 CFU of CFSE-labeled Spn as described above. Immediately following infection (0 hours post-inoculation) and 19 hours post-inoculation, mice were sacrificed and Spn in the retrotracheal nasal lavages was analyzed using flow cytometry. The time point of 19 hours was chosen since this was the latest time point where Spn replication could be assessed. Samples were fixed by treatment with 2% paraformaldehyde for 25 mins. They were stained with typing serum specific to 23F (Statens Serum Institut, Copenhagen, Denmark) at 1:1000 dilution by incubating for 25 mins at 4°C. Thereafter, they were incubated with phycoerythrin (PE)-labeled secondary anti-rabbit IgG at 1:100 dilution overnight at 4°C. Flow cytometry was performed using the LSRII flow cytometer (BD Biosciences, Franklin Lakes, NJ) and analyzed by FlowJo Software v10 (BD Life Sciences, Ashland, OR). Owing to the even split of CFSE dye between the two daughter cells per replication, a 50% decline in median fluorescence intensity of CFSE in the PE-positive population (Spn) was considered a cell division.
Competition experiment
For competition experiment, strains were grown in TS broth until they reached an OD620 of 1.0. The cells were collected, washed and resuspended in sterile PBS. Both the strains were then mixed at a ratio of 1:1. Infant pups were then inoculated intranasally as described above with 102 CFU of the mix. After two weeks, URT lavages were collected and the density of each strain was determine either by selective plating on different antibiotics or by colony immunoblotting using serotype-specific sera (as previously described19). A competitive index (CI) was calculated by comparing the output CFU ratio of the two strains obtained from the lavages to their input ratio from the inoculum. CI greater than 1 suggests a competitive advantage to the first strain, while a value less than 1 indicates an advantage for the second strain. For pups where only one strain was detected, hypothetical CI values of 1000 were assumed.
Genomic variations and Spn transmissibility
We used whole-genome sequence data collected from carriage episodes of unvaccinated mother-child pairs, which has previously been used to identify genetic variation associated with penicillin resistance and carriage duration. To define a transmissibility phenotype, we divided the dataset into genetic clusters using a k-mer based approach, PopPUNK56. 91 of these clusters had at least four samples. In these clusters, we reconstructed the number of transmission events using transphylo57, assuming an R0 of 1, sampling rate of 0.12, and average carriage duration of 61 days, as has been previously used for this dataset58. We then divided transmissions per cluster by the time to most recent common ancestor to obtain a rough estimate of transmissibility. We then used pyseer59 to associate SNP variation mapped against the D39V reference60 with this phenotype, while adjusting for population structure.
Growth and clearance calculations
The changes in allele frequency of the most abundant clone were estimated by simulating Spn population during colonization as previously described16. We used the same assumption that the colonizing population was comprised of two sub-populations: one small, actively replication sub-population (P1) and the other larger sub-population (P2) where most bacterial death and clearance occurs. Both sub-populations were assumed to consist of two clones: A (the most abundant clone) and the rest of the clones being grouped together as one (O). The population dynamics of these clones were calculated using the equations as described in that work. The stable equilibrium population was calculated under same assumptions, with a growth rate of 0.0231 min−1, clearance rate of 0.0043 min−1, and carrying capacities for both the sub-populations as 4000 and 400000. The initial state was calculated by assuming the frequency of an allele in the population to be equivalent to the observed frequency of most abundant clone at 6 hours post-inoculation. Growth and clearance rates were then varied for either of the clones (A or O) to estimate the frequency of the most abundant clone 1 day post-inoculation.
QUANTIFICATION AND STATISTICAL ANALYSIS
Statistical analysis
Statistical analyses for Figure 1 were done using a generalized linear model. For comparisons between two groups, either non-parametric (Mann-Whitney, Figs 2F) or parametric Student’s t-test (Figs 3–5) was used. For comparisons between more than two groups, either non-parametric (Kruskal-Wallis test, Figs 3D) or parametric ANOVA (Figs 3–4) followed by correction for multiple comparisons was used. For each of these comparisons, parametric test was chosen when the data followed a normal distribution. In all other cases, non-parametric tests were performed. In Fig 4J, the competitive index value was compared to a median hypothetical value of 1 using Wilcoxon test. For figures, each data point (or “n”) corresponds to an individual animal. Each data point is presented individually, with bars denoting Mean ± SD values. P<0.05 was considered as statistically significant. Further details of the statistical analyses are included in the figure legends. The statistical analyses were performed using GraphPad Prism v9.3.1 (GraphPad Software Inc., San Diego, CA) unless stated otherwise.
Supplementary Material
Table S1. Bacterial strains used in this experimental work, Related to STAR Methods.
Table S2. Primers used in this study, Related to STAR Methods.
KEY RESOURCES TABLE.
| REAGENT or RESOURCE | SOURCE | IDENTIFIER |
|---|---|---|
| Antibodies | ||
| Rabbit pneumococcal antisera type group 23 | Statens Serum Institut | Cat#16913 |
| Rabbit pneumococcal antisera type 4 | Statens Serum Institut | Cat#16747 |
| R-phycoerythrin-conjugated goat anti-rabbit IgG | Jackson ImmunoResearch Labs | Cat#111-116-144; RRID: AB_2337985 |
| Bacterial and virus strains | ||
| Streptococcus pneumoniae 23F strain (P2499) | Shen et al., 2019 | N/A |
| Streptococcus pneumoniae TIGR4 strain (P2406) | Zafar et al., 2016 | N/A |
| Streptococcus pneumoniae 23F 𝚫cbpD𝚫cibABC strain (P2576) | Shen et al., 2019 | N/A |
| Streptococcus pneumoniae 23F blpC::Janus strain (P2644) | This paper | N/A |
| Streptococcus pneumoniae 23F 𝚫blpC strain (P2646) | This paper | N/A |
| Streptococcus pneumoniae 23F blp::Janus strain (P2700) | This paper | N/A |
| Streptococcus pneumoniae 23F 𝚫blp strain (P2706) | This paper | N/A |
| 5-alpha Competent Escherichia coli (DH5α) | New England Biolabs | Cat#C2987H |
| Influenza A virus: IAV/HKx31 (H3N2) | Zafar et al., 2016 | N/A |
| Chemicals, peptides, and recombinant proteins | ||
| Catalase, filtered | Worthington Biochemical Corporation | Cat#LS001896 |
| Competence Stimulating Peptide: CSP1 | AnaSpec Inc. | Cat#AS-63779 |
| Competence Stimulating Peptide: CSP2 | AnaSpec Inc. | Cat#AS-63877 |
| CFSE | Invitrogen eBioscience | Cat#65-0850-84 |
| Critical commercial assays | ||
| Plasmid Midi Kit | QIAGEN | Cat#12145 |
| MasterPure Complete DNA & RNA Purification Kit | Lucigen | Cat# MC85200 |
| QIAquick PCR & Gel Cleanup Kit | QIAGEN | Cat#28506 |
| Experimental models: Organisms/strains | ||
| Mouse: C57BL/6J | The Jackson Laboratory | JAX: 000664; RRID: IMSR_JAX:000664 |
| Mouse: B6.129-Tlr2tm1Kir/J (Tlr2−/−) | The Jackson Laboratory | JAX: 004650; RRID: IMSR_JAX:004650 |
| Mouse: B6.129S7-Il1r1tm1Imx/J (Ilr1−/−) | The Jackson Laboratory | JAX: 003245; RRID: IMSR_JAX:003245 |
| Mouse: Il17ra−/− | Amgen Inc. | N/A |
| Software and algorithms | ||
| iNEXT | Chao et al., 2014 and Hseih et al., 2016 | NA |
| Beaumont’s adaptive algorithm | Beaumont et al., 2009 | NA |
| FlowJo Software v10 | BD Life Sciences | NA |
| PopPUNK | Lees et al., 2019 | NA |
| transphylo | Didelot et al., 2017 | NA |
| pyseer | Lees et al., 2018 | NA |
| GraphPad Prism v9.3.1 | Graphpad Software Inc. | NA |
| Other | ||
| Code for analyzing sequencing data | This paper | https://github.com/sda26/pneumo_diversity |
| Code for running population genetic simulations, fitting to data, and fitting generalized linear models | This paper | https://github.com/johnlees/transmission_blp |
Highlights.
Streptococcus pneumoniae show loss of clonal diversity early during colonization
Bactericidal program induced by quorum sensing pheromone BlpC reduces diversity
BlpC signaling tightens bottlenecks and drives loss of diversity during transmission
ACKNOWLEDGEMENTS
We thank Dr. Kristen Lokken-Toyli for her suggestions and feedback. The illustrations were created with BioRender.com. This work was funded by NIH grants R01 AI50893, R01 AI038446, and R21 AI50867 to JNW. NTJ was supported by NIH grant T32 AI007180-37.
Footnotes
DECLARATION OF INTERESTS
The authors declare no competing interests.
REFERENCES
- 1.Weiser JN, Ferreira DM, and Paton JC (2018). Streptococcus pneumoniae: transmission, colonization and invasion. Nat. Rev. Microbiol. 16, 355–367. [DOI] [PMC free article] [PubMed] [Google Scholar]
- 2.van Opijnen T, and Camilli A (2012). A fine scale phenotype-genotype virulence map of a bacterial pathogen. Genome Res. 22, 2541–2551. [DOI] [PMC free article] [PubMed] [Google Scholar]
- 3.Zafar MA et al. (2019). Identification of pneumococcal factors affecting pneumococcal shedding shows that the dlt locus promotes inflammation and transmission. MBio 10, e01032–19. [DOI] [PMC free article] [PubMed] [Google Scholar]
- 4.Rowe HM et al. (2019). Bacterial factors required for transmission of Streptococcus pneumoniae in mammalian hosts. Cell Host Microbe 25, 884–891. [DOI] [PMC free article] [PubMed] [Google Scholar]
- 5.Matthews AJ, Rowe HM, Rosch JW, and Camilli A (2021). A Tn-seq screen of Streptococcus pneumoniae uncovers DNA repair as the major pathway for desiccation tolerance and transmission. Infect. Immun. 89, e00713–20. [DOI] [PMC free article] [PubMed] [Google Scholar]
- 6.D’Mello A et al. (2020). An in vivo atlas of host–pathogen transcriptomes during Streptococcus pneumoniae colonization and disease. Proc. Natl. Acad. Sci. U. S. A. 117, 33507–33518. [DOI] [PMC free article] [PubMed] [Google Scholar]
- 7.Fiebig A et al. (2021). Quantification of Brucella abortus population structure in a natural host. Proc. Natl. Acad. Sci. U. S. A. 118, e2023500118. [DOI] [PMC free article] [PubMed] [Google Scholar]
- 8.Martin CJ et al. (2017). Digitally barcoding Mycobacterium tuberculosis reveals in vivo infection dynamics in the macaque model of tuberculosis. MBio 8, e00312–17. [DOI] [PMC free article] [PubMed] [Google Scholar]
- 9.Bachta KER, Allen JP, Cheung BH, Chiu CH, and Hauser AR (2020). Systemic infection facilitates transmission of Pseudomonas aeruginosa in mice. Nat. Commun. 11, 543. [DOI] [PMC free article] [PubMed] [Google Scholar]
- 10.Hullahalli K, and Waldor MK (2021). Pathogen clonal expansion underlies multiorgan dissemination and organ-specific outcomes during systemic infection. Elife 10, e70910. [DOI] [PMC free article] [PubMed] [Google Scholar]
- 11.Jasinska W et al. (2020). Chromosomal barcoding of E. coli populations reveals lineage diversity dynamics at high resolution. Nat. Ecol. Evol. 4, 437–452. [DOI] [PubMed] [Google Scholar]
- 12.Vasquez KS et al. (2021). Quantifying rapid bacterial evolution and transmission within the mouse intestine. Cell Host Microbe 29, 1454–1468. [DOI] [PMC free article] [PubMed] [Google Scholar]
- 13.Hullahalli K, Pritchard JR, and Waldor MK (2021). Refined quantification of infection bottlenecks and pathogen dissemination with STAMPR. mSystems 6, e00887–21. [DOI] [PMC free article] [PubMed] [Google Scholar]
- 14.Zafar MA, Kono M, Wang Y, Zangari T, and Weiser JN (2016). Infant mouse model for the study of shedding and transmission during Streptococcus pneumoniae monoinfection. Infect. Immun. 84, 2714–2722. [DOI] [PMC free article] [PubMed] [Google Scholar]
- 15.Kono M et al. (2016). Single cell bottlenecks in the pathogenesis of Streptococcus pneumoniae. PLoS Pathog. 12, e1005887. [DOI] [PMC free article] [PubMed] [Google Scholar]
- 16.Li Y, Thompson CM, Trzciński K, and Lipsitch M (2013). Within-host selection is limited by an effective population of Streptococcus pneumoniae during nasopharyngeal colonization. Infect. Immun. 81, 4534–4543. [DOI] [PMC free article] [PubMed] [Google Scholar]
- 17.Siegel SJ, Tamashiro E, and Weiser JN (2015). Clearance of pneumococcal colonization in infants Is delayed through altered macrophage trafficking. PLoS Pathog. 11, e1005004. [DOI] [PMC free article] [PubMed] [Google Scholar]
- 18.Siegel SJ, Roche AM, and Weiser JN (2014). Influenza promotes pneumococcal growth during coinfection by providing host sialylated substrates as a nutrient source. Cell Host Microbe 16, 55–67. [DOI] [PMC free article] [PubMed] [Google Scholar]
- 19.Abruzzo AR, Aggarwal SD, Sharp ME, Bee GCW, and Weiser JN (2022). Serotype-dependent effects on the dynamics of pneumococcal colonization and implications for transmission. MBio 13, e00158–22. [DOI] [PMC free article] [PubMed] [Google Scholar]
- 20.van Rossum AMC, Lysenko ES, and Weiser JN (2005). Host and bacterial factors contributing to the clearance of colonization by Streptococcus pneumoniae in a murine model. Infect. Immun. 73, 7718–7726. [DOI] [PMC free article] [PubMed] [Google Scholar]
- 21.Lu Y-J et al. (2008). Interleukin-17A mediates acquired immunity to pneumococcal colonization. PLoS Pathog. 4, e1000159. [DOI] [PMC free article] [PubMed] [Google Scholar]
- 22.Zhang Z, Clarke TB, and Weiser JN (2009). Cellular effectors mediating Th17-dependent clearance of pneumococcal colonization in mice. J. Clin. Invest. 119, 1899–1909. [DOI] [PMC free article] [PubMed] [Google Scholar]
- 23.Kuipers K et al. (2018). Age-related differences in IL-1 signaling and capsule serotype affect persistence of Streptococcus pneumoniae colonization. PLoS Pathog. 14, e1007396. [DOI] [PMC free article] [PubMed] [Google Scholar]
- 24.Shen P, Lees JA, Bee GCW, Brown SP, and Weiser JN (2019). Pneumococcal quorum sensing drives an asymmetric owner-intruder competitive strategy during carriage via the competence regulon. Nat. Microbiol. 4, 198–208. [DOI] [PMC free article] [PubMed] [Google Scholar]
- 25.Javan RR, van Tonder AJ, King JP, Harrold CL, and Brueggemann AB (2018). Genome sequencing reveals a large and diverse repertoire of antimicrobial peptides. Front. Microbiol. 9, 2012. [DOI] [PMC free article] [PubMed] [Google Scholar]
- 26.Aggarwal SD, Yesilkaya H, Dawid S, and Hiller NL (2020). The pneumococcal social network. PLoS Pathog. 16, e1008931. [DOI] [PMC free article] [PubMed] [Google Scholar]
- 27.de Saizieu A et al. (2000). Microarray-based identification of a novel Streptococcus pneumoniae regulon controlled by an autoinduced peptide. J. Bacteriol. 182, 4696–4703. [DOI] [PMC free article] [PubMed] [Google Scholar]
- 28.Reichmann P, and Hakenbeck R (2000). Allelic variation in a peptide-inducible two-component system of Streptococcus pneumoniae. FEMS Microbiol. Lett. 190, 231–236. [DOI] [PubMed] [Google Scholar]
- 29.Dawid S, Roche AM, and Weiser JN (2007). The blp bacteriocins of Streptococcus pneumoniae mediate intraspecies competition both in vitro and in vivo. Infect. Immun. 75, 443–451. [DOI] [PMC free article] [PubMed] [Google Scholar]
- 30.Wholey W-Y, Kochan TJ, Storck DN, and Dawid S (2016). Coordinated bacteriocin expression and competence in Streptococcus pneumoniae contributes to genetic adaptation through neighbor predation. PLOS Pathog. 12, e1005413. [DOI] [PMC free article] [PubMed] [Google Scholar]
- 31.Valente C et al. (2016). The blp locus of Streptococcus pneumoniae plays a limited role in the selection of strains that can cocolonize the human nasopharynx. Appl. Environ. Microbiol. 82, 5206–5215. [DOI] [PMC free article] [PubMed] [Google Scholar]
- 32.Lees JA et al. (2017). Genome-wide identification of lineage and locus specific variation associated with pneumococcal carriage duration. Elife 6, e26255. [DOI] [PMC free article] [PubMed] [Google Scholar]
- 33.Dar D, Dar N, Cai L, and Newman DK (2021). Spatial transcriptomics of planktonic and sessile bacterial populations at single-cell resolution. Science 373, eabi4882. [DOI] [PMC free article] [PubMed] [Google Scholar]
- 34.Davis KM, Mohammadi S, and Isberg RR (2015). Community behavior and spatial regulation within a bacterial microcolony in deep tissue sites serves to protect against host attack. Cell Host Microbe 17, 21–31. [DOI] [PMC free article] [PubMed] [Google Scholar]
- 35.Bogaardt C, van Tonder AJ, and Brueggemann AB (2015). Genomic analyses of pneumococci reveal a wide diversity of bacteriocins - including pneumocyclicin, a novel circular bacteriocin. BMC Genomics 16, 554. [DOI] [PMC free article] [PubMed] [Google Scholar]
- 36.Miller EL, Abrudan MI, Roberts IS, and Rozen DE (2016). Diverse ecological strategies are encoded by Streptococcus pneumoniae bacteriocin-like peptides. Genome Biol. Evol. 8, 1072–1090. [DOI] [PMC free article] [PubMed] [Google Scholar]
- 37.Chaguza C et al. (2020). Within-host microevolution of Streptococcus pneumoniae is rapid and adaptive during natural colonisation. Nat. Commun. 11, 3442. [DOI] [PMC free article] [PubMed] [Google Scholar]
- 38.González-Pastor JE, Hobbs EC, and Losick R (2003). Cannibalism by sporulating bacteria. Science 301, 510–513. [DOI] [PubMed] [Google Scholar]
- 39.Bushin LB, Covington BC, Rued BE, Federle MJ, and Seyedsayamdost MR (2020). Discovery and biosynthesis of Streptosactin, a sactipeptide with an alternative topology encoded by commensal bacteria in the human microbiome. J. Am. Chem. Soc. 142, 16265–16275. [DOI] [PubMed] [Google Scholar]
- 40.Zhu Y et al. (2021). CrfP, a fratricide protein, contributes to natural transformation in Streptococcus suis. Vet. Res. 52, 50. [DOI] [PMC free article] [PubMed] [Google Scholar]
- 41.Jamet A et al. (2015). A new family of secreted toxins in pathogenic Neisseria species. PLoS Pathog. 11, e1004592. [DOI] [PMC free article] [PubMed] [Google Scholar]
- 42.Arenas J et al. (2015). Fratricide activity of MafB protein of N. meningitidis strain B16B6. BMC Microbiol. 15, 156. [DOI] [PMC free article] [PubMed] [Google Scholar]
- 43.McCool TL, Cate TR, Moy G, and Weiser JN (2002). The immune response to pneumococcal proteins during experimental human carriage. J. Exp. Med. 195, 359–365. [DOI] [PMC free article] [PubMed] [Google Scholar]
- 44.Hammond AJ et al. (2021). Neuraminidase B controls neuraminidase A-dependent mucus production and evasion. PLoS Pathog. 17, e1009158. [DOI] [PMC free article] [PubMed] [Google Scholar]
- 45.Zangari T, Ortigoza MB, Lokken-Toyli KL, and Weiser JN (2021). Type I interferon signaling is a common factor driving Streptococcus pneumoniae and Influenza A virus shedding and transmission. MBio 12, e03589–20. [DOI] [PMC free article] [PubMed] [Google Scholar]
- 46.Richard AL, Siegel SJ, Erikson J, and Weiser JN (2014). TLR2 signaling decreases transmission of Streptococcus pneumoniae by limiting bacterial shedding in an infant mouse Influenza A co-infection model. PLoS Pathog. 10, e1004339. [DOI] [PMC free article] [PubMed] [Google Scholar]
- 47.Aggarwal SD et al. (2021). Competence-associated peptide BriC alters fatty acid biosynthesis in Streptococcus pneumoniae. mSphere 6, e00145–21. [DOI] [PMC free article] [PubMed] [Google Scholar]
- 48.Aggarwal SD et al. (2021). A molecular link between cell wall biosynthesis, translation fidelity, and stringent response in Streptococcus pneumoniae. Proc. Natl. Acad. Sci. 118, e2018089118. [DOI] [PMC free article] [PubMed] [Google Scholar]
- 49.Sung CK, Li H, Claverys JP, and Morrison DA (2001). An rpsL cassette, Janus, for gene replacement through negative selection in Streptococcus pneumoniae. Appl. Environ. Microbiol. 67, 5190–5196. [DOI] [PMC free article] [PubMed] [Google Scholar]
- 50.Weiser JN et al. (2003). Antibody-enhanced pneumococcal adherence requires IgA1 protease. Proc. Natl. Acad. Sci. U. S. A. 100, 4215–4220. [DOI] [PMC free article] [PubMed] [Google Scholar]
- 51.Bolger AM, Lohse M, and Usadel B (2014). Trimmomatic: A flexible trimmer for Illumina sequence data. Bioinformatics 30, 2114–2120. [DOI] [PMC free article] [PubMed] [Google Scholar]
- 52.Li H (2013). Aligning sequence reads, clone sequences and assembly contigs with BWA-MEM. arXiv 1303.3997v2 doi:http://arxiv.org/abs/1303.3997. [Google Scholar]
- 53.Chao A et al. (2014). Rarefaction and extrapolation with Hill numbers: A framework for sampling and estimation in species diversity studies. Ecol. Monogr. 84, 45–67. [Google Scholar]
- 54.Hsieh TC, Ma KH, and Chao A (2016). iNEXT: an R package for rarefaction and extrapolation of species diversity (Hill numbers). Methods Ecol. Evol. 7, 1451–1456. [Google Scholar]
- 55.Beaumont MA, Cornuet J-M, Marin J-M, and Robert CP (2009). Adaptive approximate Bayesian computation. Biometrika 96, 983–990. [Google Scholar]
- 56.Lees JA et al. (2019). Fast and flexible bacterial genomic epidemiology with PopPUNK. Genome Res. 29, 304–316. [DOI] [PMC free article] [PubMed] [Google Scholar]
- 57.Didelot X, Fraser C, Gardy J, and Colijn C (2017). Genomic infectious disease epidemiology in partially sampled and ongoing outbreaks. Mol. Biol. Evol. 34, 997–1007. [DOI] [PMC free article] [PubMed] [Google Scholar]
- 58.Tonkin-Hill G et al. (2022). Pneumococcal within-host diversity during colonisation, transmission and treatment. Nat. Microbiol. 10.1038/s41564-022-01238-1. [DOI] [PMC free article] [PubMed] [Google Scholar]
- 59.Lees JA, Galardini M, Bentley SD, Weiser JN, and Corander J (2018). pyseer: A comprehensive tool for microbial pangenome-wide association studies. Bioinformatics 34, 4310–4312. [DOI] [PMC free article] [PubMed] [Google Scholar]
- 60.Slager J, Aprianto R, and Veening J-W (2018). Deep genome annotation of the opportunistic human pathogen Streptococcus pneumoniae D39. Nucleic Acids Res. 46, 9971–9989. [DOI] [PMC free article] [PubMed] [Google Scholar]
Associated Data
This section collects any data citations, data availability statements, or supplementary materials included in this article.
Supplementary Materials
Table S1. Bacterial strains used in this experimental work, Related to STAR Methods.
Table S2. Primers used in this study, Related to STAR Methods.
Data Availability Statement
All data reported in this paper will be shared by the lead contact upon request.
The code for analyzing the sequencing data is available at https://github.com/sda26/pneumo_diversity. The code for running population genetic simulations, fitting to data, and fitting generalized linear models is available at https://github.com/johnlees/transmission_blp (version 1.0, Apache 2.0 license).
Any additional information required to reanalyze the data reported in this work paper is available from the Lead Contact upon request.