
Figure 4. Phenylacetic acid (PAA) is produced by gut microbiota via oxidative and non-oxidative phenylpyruvic acid decarboxylation.
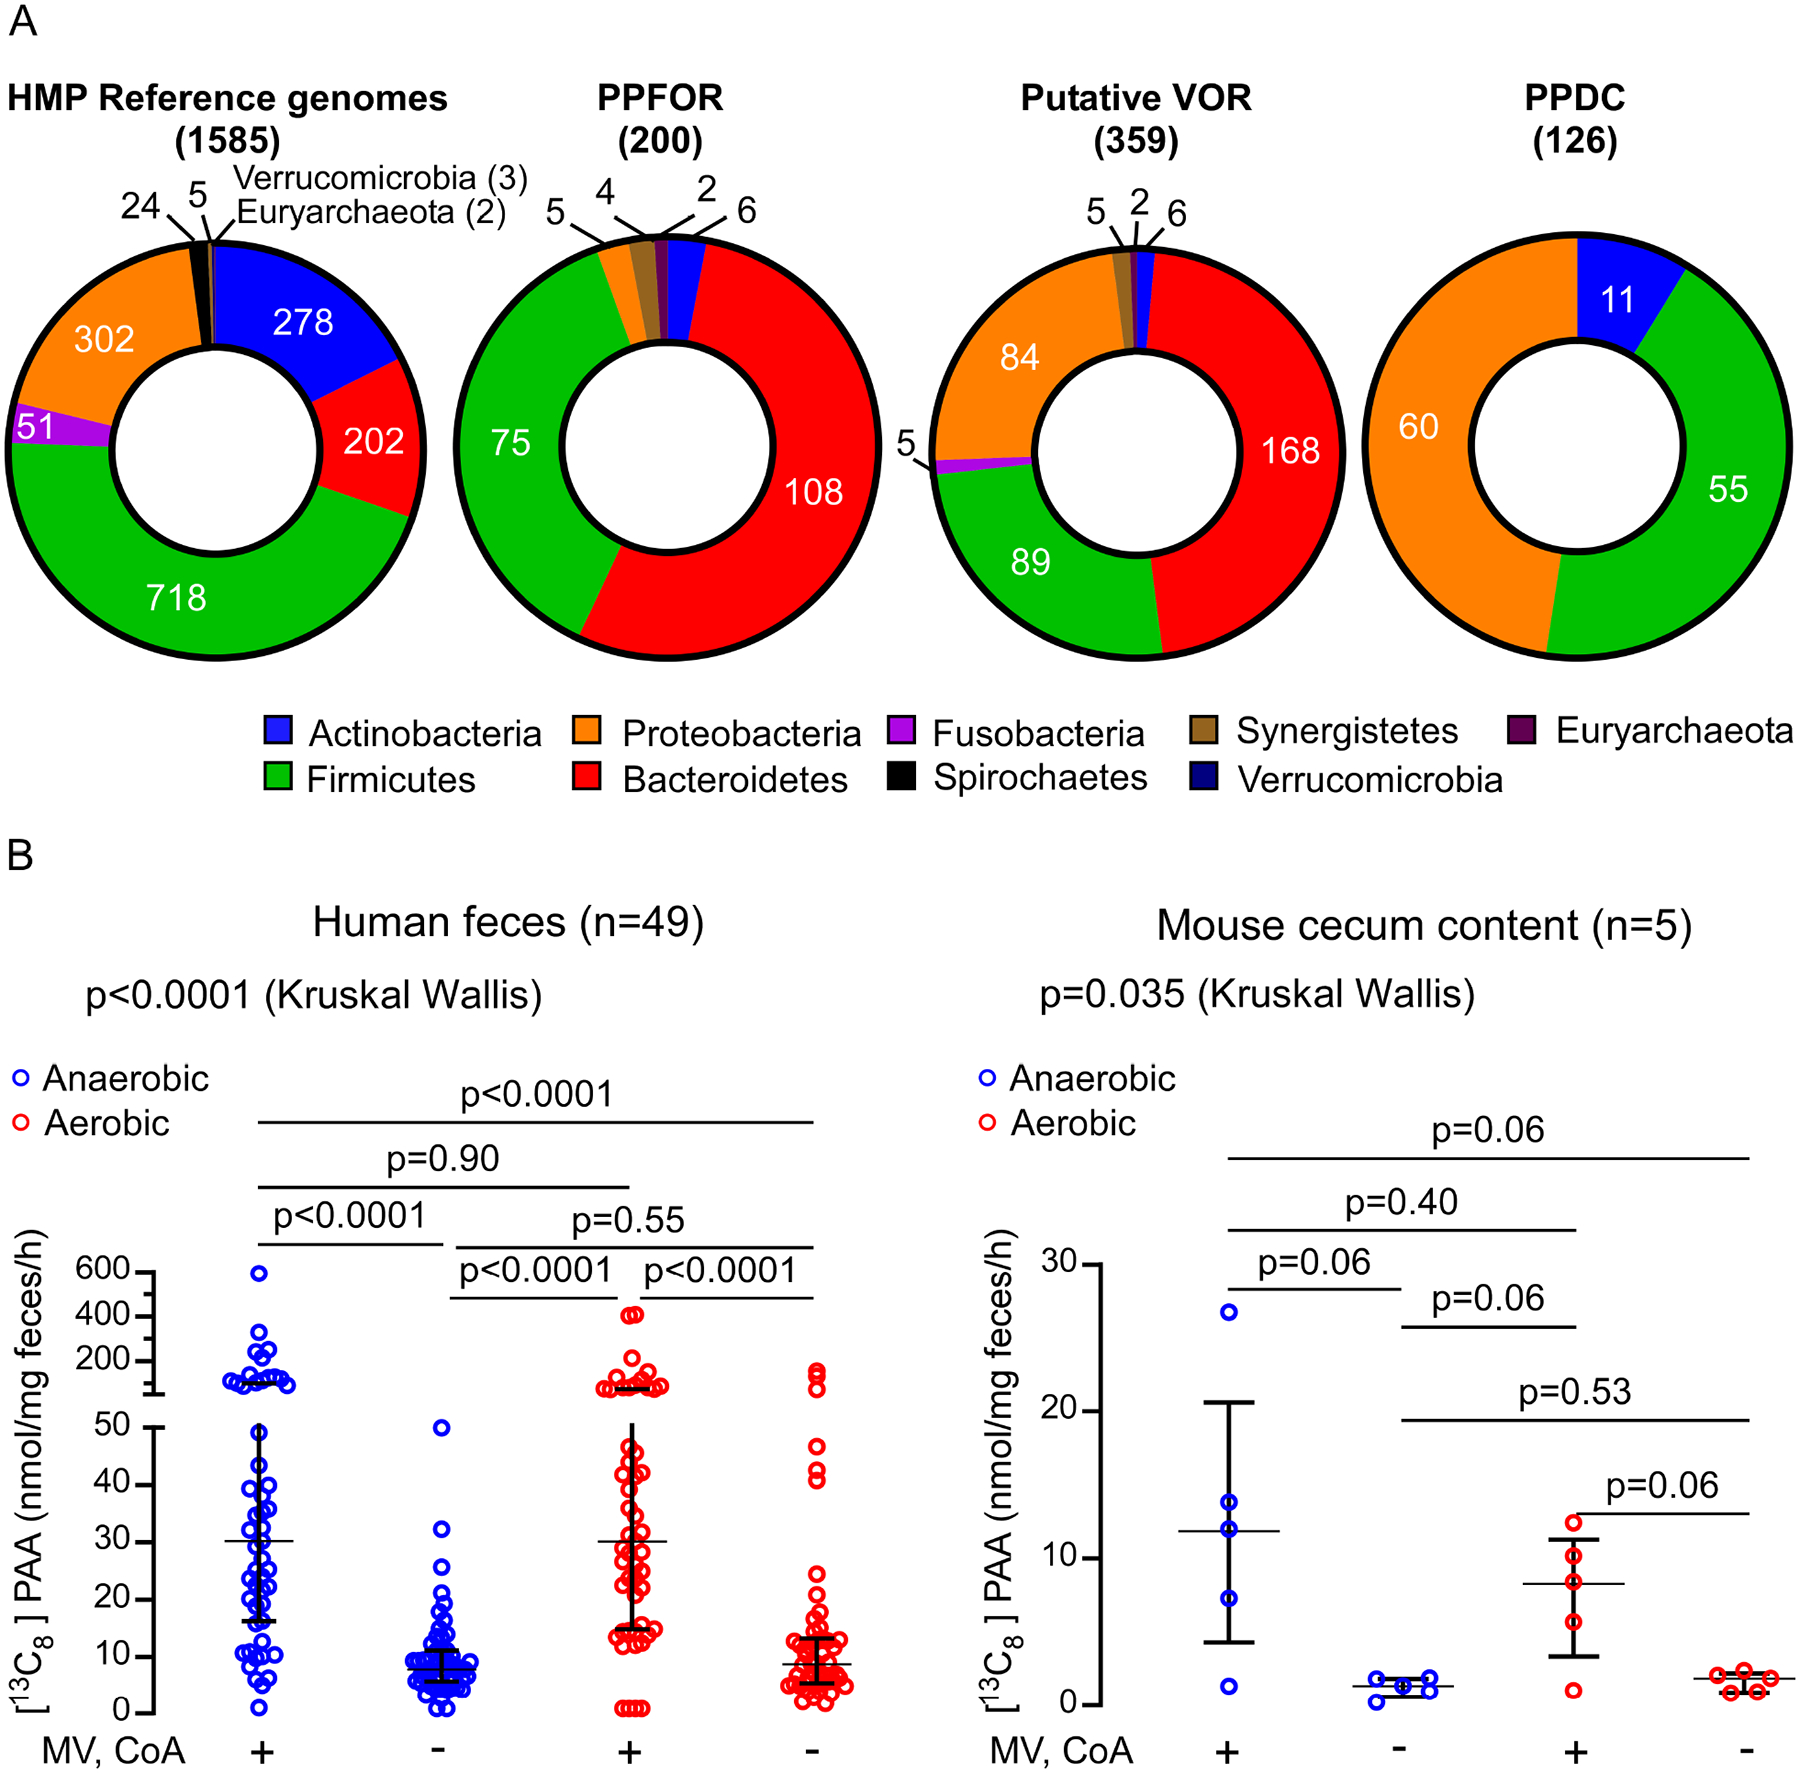
(A) Distribution of PPFOR, VOR and PPDC homologs in Human Microbiome Project (HMP) reference genomes.
The pie charts show the total number of microbial genomes harboring the corresponding subject (PPFOR, VOR, or PPDC homologues) classified according to the phyla. The leftmost chart shows the total number of microbial genomes included in the analyses for each phylum. Analyses were performed using the COG functions; COG3961 (for PPDC), COG4231 and COG1014 (for PPFOR) and COG0674, COG1013, and COG1014 (for VOR). The gene cluster architecture of PPFOR and VOR homologs are inspected manually for each hit. See Supplementary Tables S3, for detailed gene locus tag, strain information and percent identity for each hit to the corresponding subject (PPFOR of B.thetaiotaomicron, VOR of C. sporogenes and PPDC of P. mirabilis).
(B) PAA is produced both anaerobically and aerobically by human fecal microbiome (left, n=49) and mouse cecum microbiome (right, n=5). Human fecal and mouse cecal slurry supernatants were incubated with [13C9,15N]-Phe. [13C8]-PAA was quantified by LC-MS/MS. The reaction was done under anaerobic (blue) and aerobic (red) conditions. MV and CoA were included in the assay to facilitate PPFOR/VOR mediated oxidative decarboxylation. Each mouse cecum was done in three independent replicates and the averages of these replicates are plotted. Medians with interquartile ranges are shown. Significance was determined using Kruskal Wallis test.