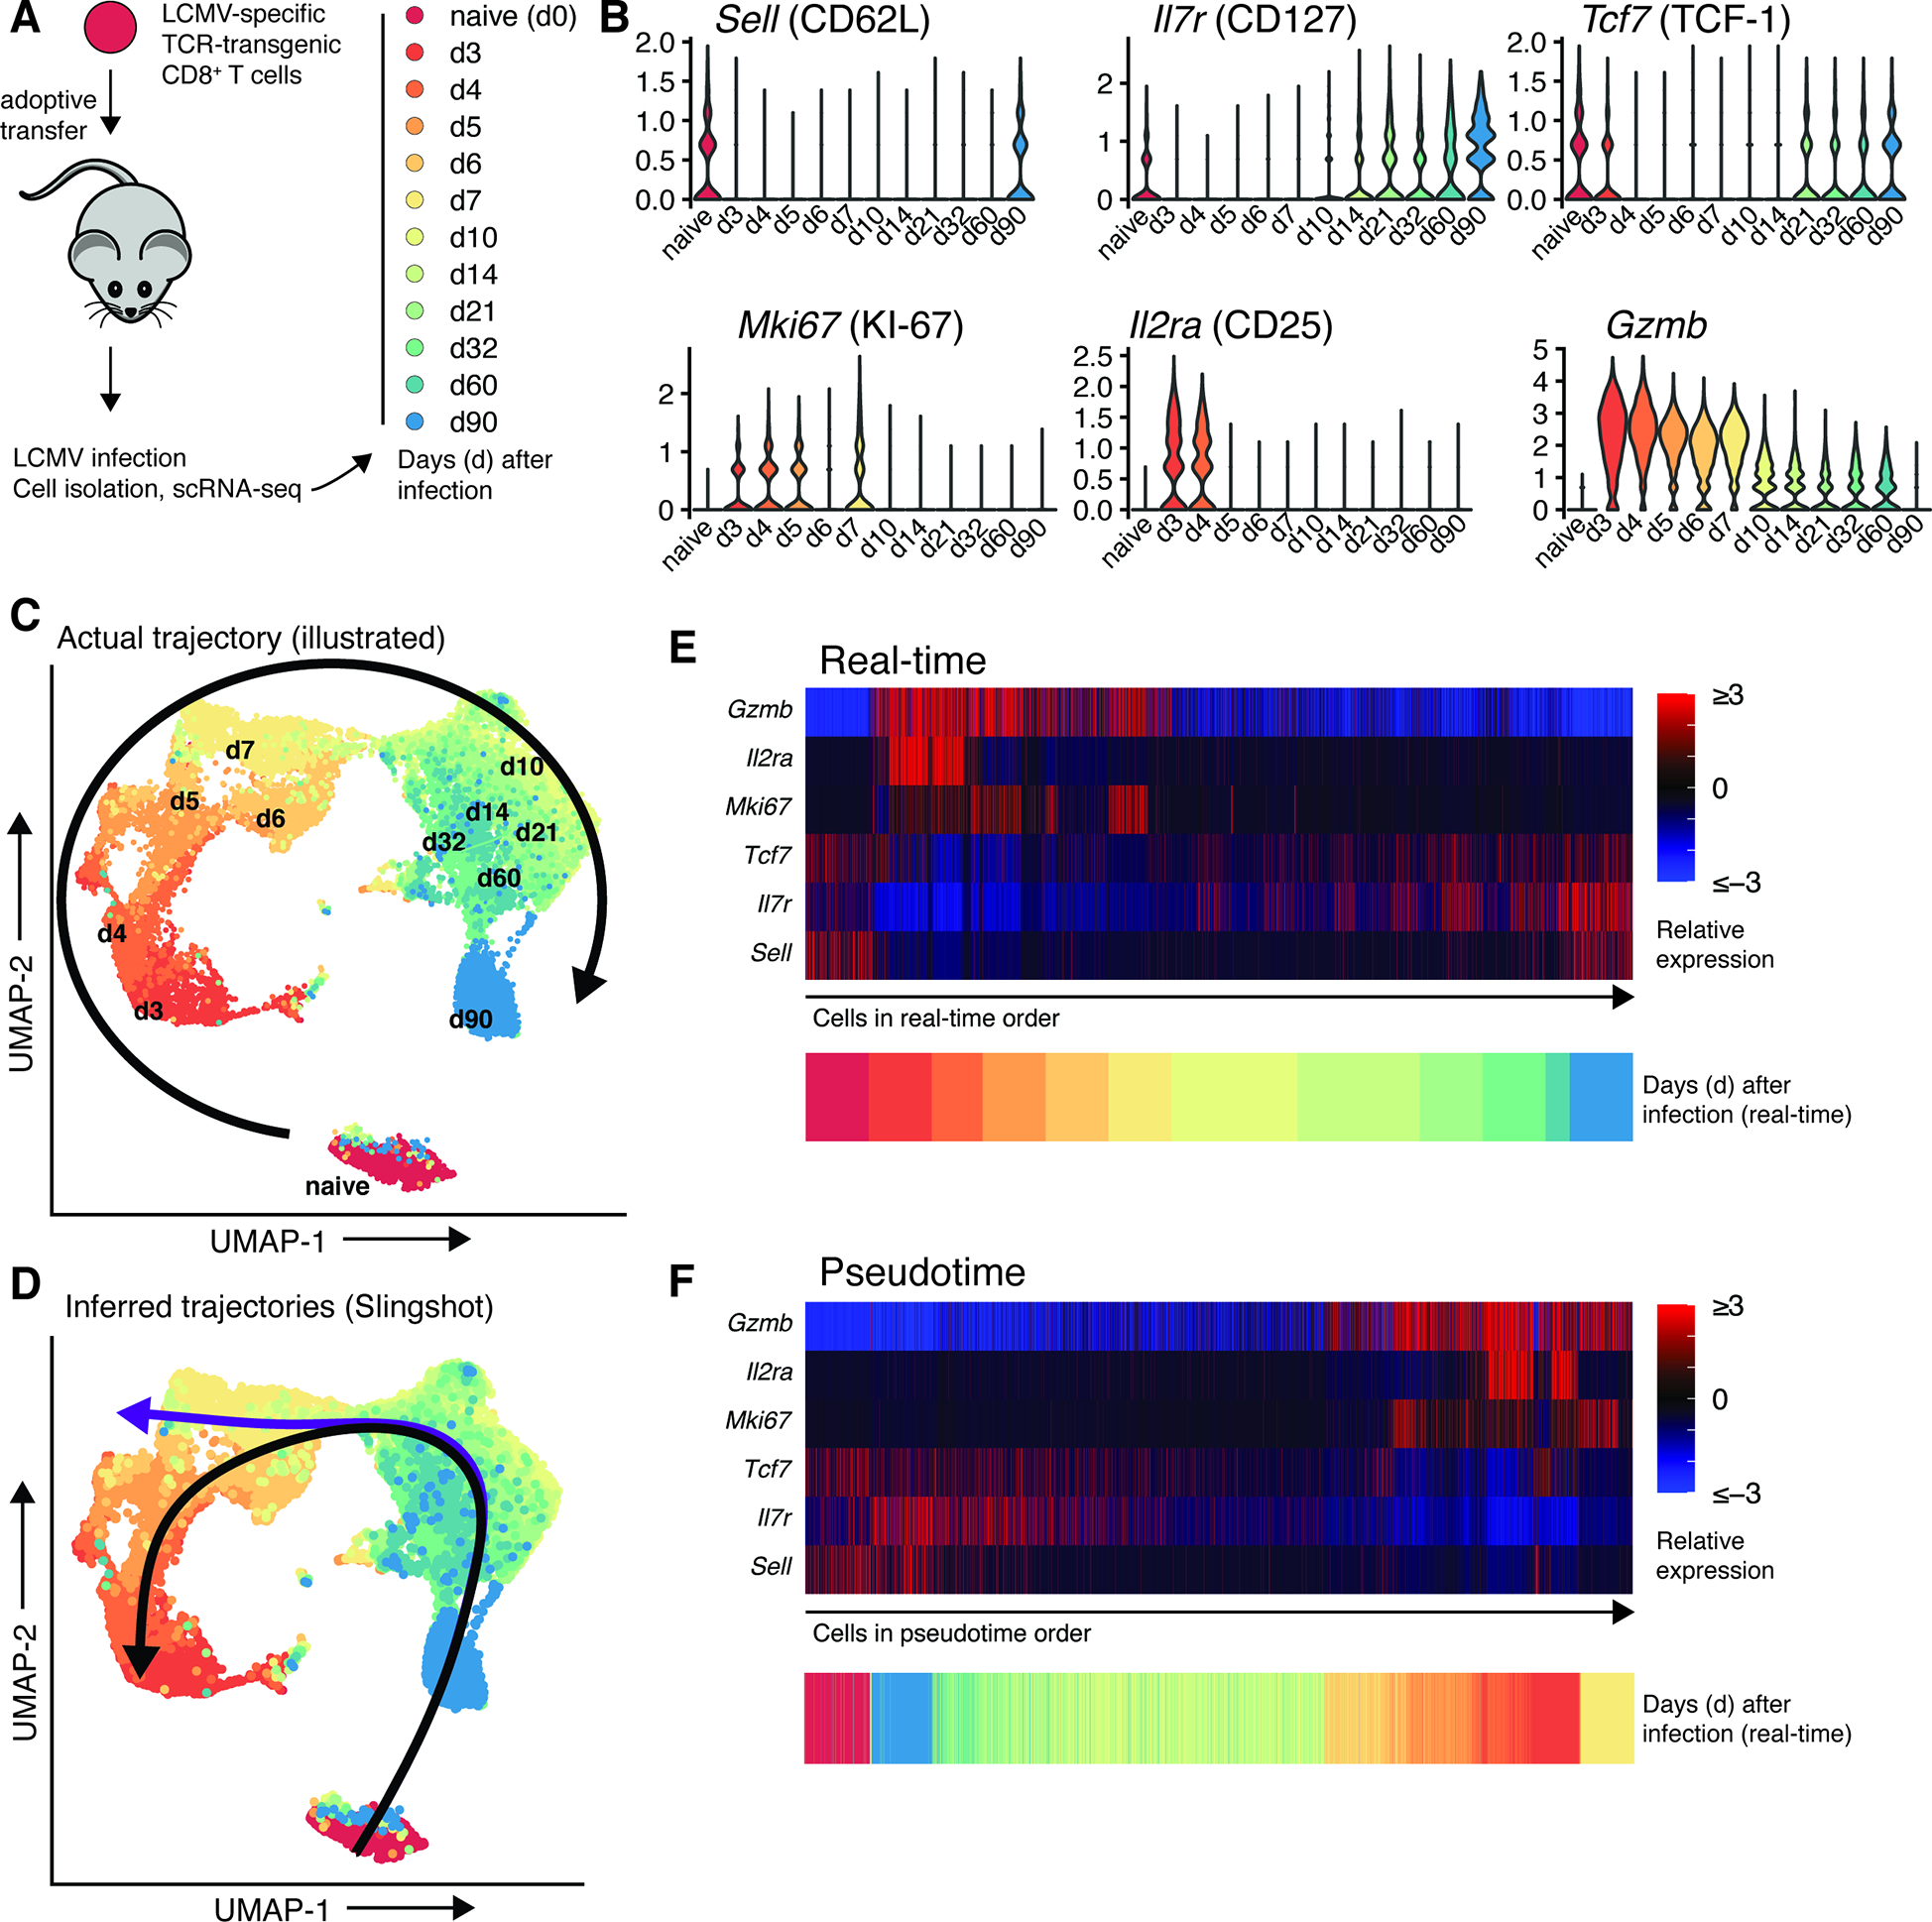
Figure 2:

Inference of a reverse differentiation trajectory from scRNA-seq data. A: TCR-transgenic CD8+ T cells were transferred to mice which were subsequently infected with LCMV Armstrong. At illustrated timepoints, cells were sorted and subjected to scRNA-seq. B: Expression of T cell differentiation markers at indicated time points. C: UMAP projection of sequenced cells, with an illustrated arrow showing actual cell differentiation trajectory. D: Identical UMAP projection, with inferred trajectories. E: Heatmap of T cell differentiation marker expression, with cells in real-time order. F: Heatmap of T cell differentiation marker expression, with cells in pseudotime order. Raw data are from (Kurd et al., 2020). Code and data to reproduce the scRNA-seq analysis are available on Mendeley Data, doi: 10.17632/3dvt79c7yt.1.
