Figure 5:

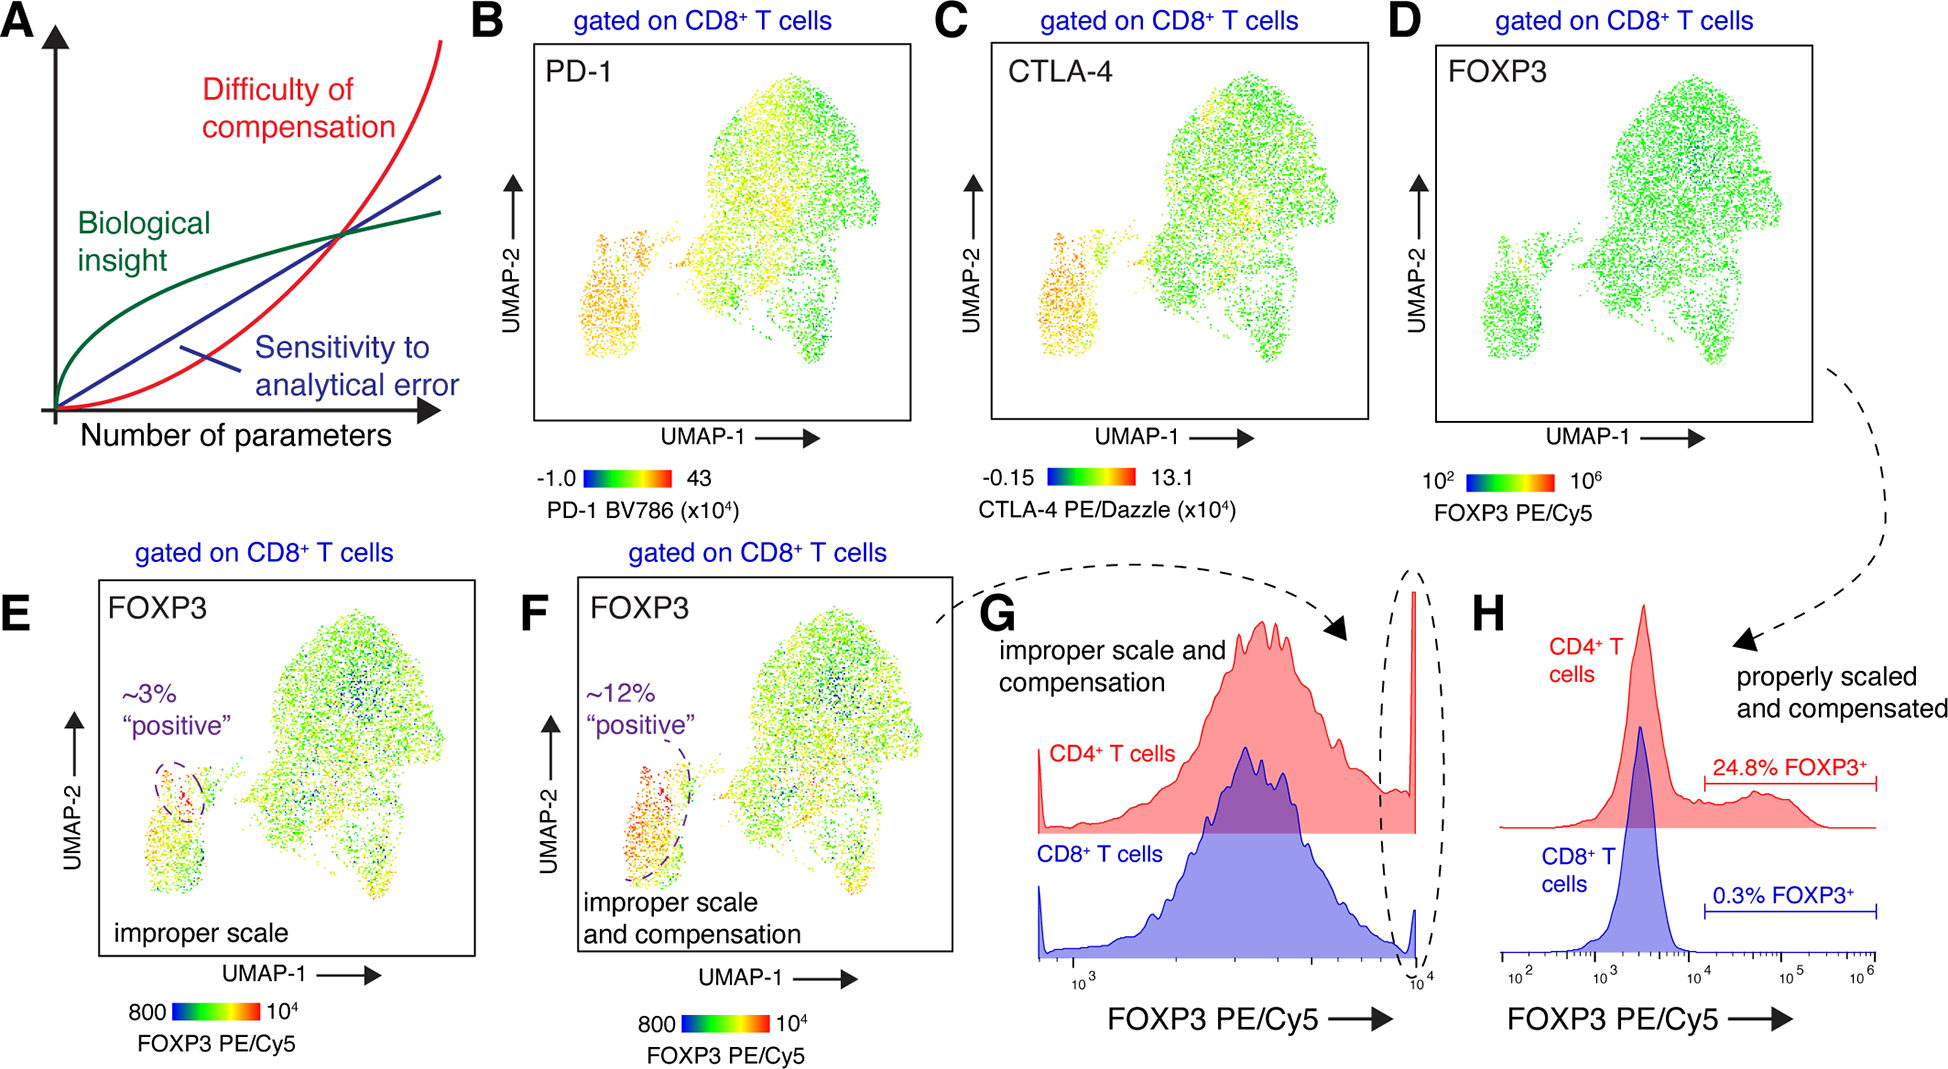
Perils of data visualization and analysis in high-parameter flow cytometry. A: As more parameters are collected in a flow cytometry experiment, the potential biological insight increases. Unfortunately, both the difficulty of analysis and sensitivity of the experiment to such error also increase. An example is shown in panels B-H, where tumor-infiltrating lymphocytes from a brain metastasis patient were analyzed with a T cell-focused, 22-color flow cytometry panel. B-D: UMAP projection of CD8+ T cells, with cells colored by expression of PD-1 (B), CTLA-4 (C), and FOXP3 (D). Data shown are properly compensated and scaled. E: UMAP projection of CD8+ T cells, with cells colored by expression of FOXP3. The color intensity scale has been modified compared to panel (D); data are properly compensated. F: UMAP projection of CD8+ T cells, with cells colored by expression of FOXP3 (same scale as panel E). Fluorescence spillover of CTLA-4 PE/Dazzle into FOXP3 PE/Cy5 has been undercompensated by 10%. (G) An alternate display method, such as a histogram, using an internal positive control for FOXP3 expression would reveal improper scaling of FOXP3 fluorescence intensities (circled population). H: The true percentage of FOXP3+ CD8+ T cells in this sample is <0.5%. Data to reproduce the flow cytometry analysis are available on Mendeley Data, doi: 10.17632/3dvt79c7yt.1.
