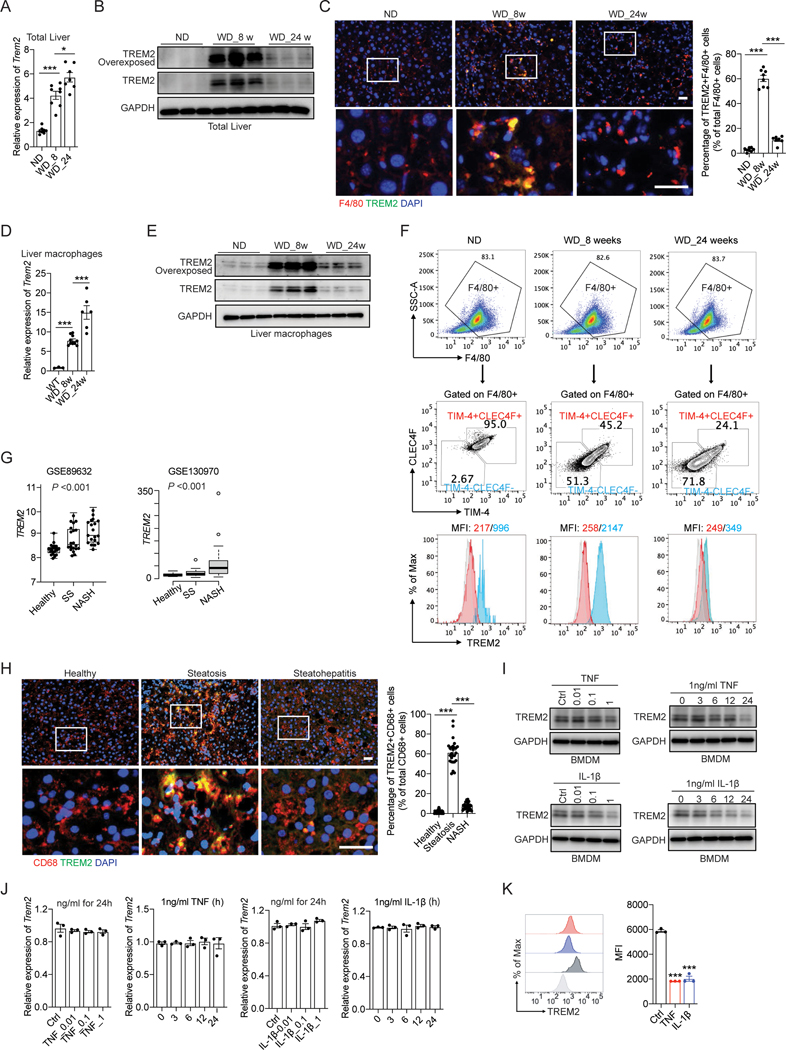
Figure 3. Uncoupled regulation of Trem2 mRNA and its protein during NASH development.
(A and B) RT-qPCR analysis of Trem2 mRNA (A) and immunoblot analysis of TREM2 (B) in liver tissue from C57BL/6 mice. ND, n = 8 mice; WD_8w, n = 8 mice; WD_24w, n= 7 mice.
(C) Representative immunofluorescent staining of F4/80 (Red) and TREM2 (Green) in liver sections. The percentage of double positive cells (F4/80+TREM2+) in total number of macrophages (F4/80+) was quantified.
(D and E) RT-qPCR analysis of Trem2 mRNA (D) and immunoblot analysis of TREM2 (E) in primary liver macrophages isolated from C57BL/6 mice. ND, n = 3 mice; WD_8w, n = 10 mice; WD_24w, n = 6 mice.
(F) Flow cytometry analysis of CLEC4F and TIM-4 in F4/80+ liver macrophages isolated from C57BL/6 mice using anti-CD11b magnetic beads. Cell surface TREM2 in TIM-4−CLEC4F− recruited macrophages and TIM-4+CLEC4F+ resident macrophages was further quantified by MFI.
(G) Database (GSE89632, n = 63 and GSE130970, n = 78) analysis of TREM2 mRNA in two independent clinical cohorts of individuals with healthy, simple steatosis (SS), and NASH livers.
(H) Representative immunofluorescent staining of CD68 and TREM2 in human liver sections.
(I and J) immunoblot analysis of TREM2 (I) and RT-qPCR analysis of Trem2 mRNA (J) in BMDMs treated with TNF or IL-1β for 24 hours, or with 1 ng/ml of TNF or IL-1β for different time durations (hours).
(K) Flow cytometry analysis of cell surface TREM2 in BMDMs treated with 1 ng/ml TNF or IL-1β for 24 hours.
Scale bar, 100 μm. Data are shown as mean ± s.e.m.. *p<0.05; ***p<0.001. All in vitro experiments were repeated independently at least three times. See also Figure S3 and Table S2.

