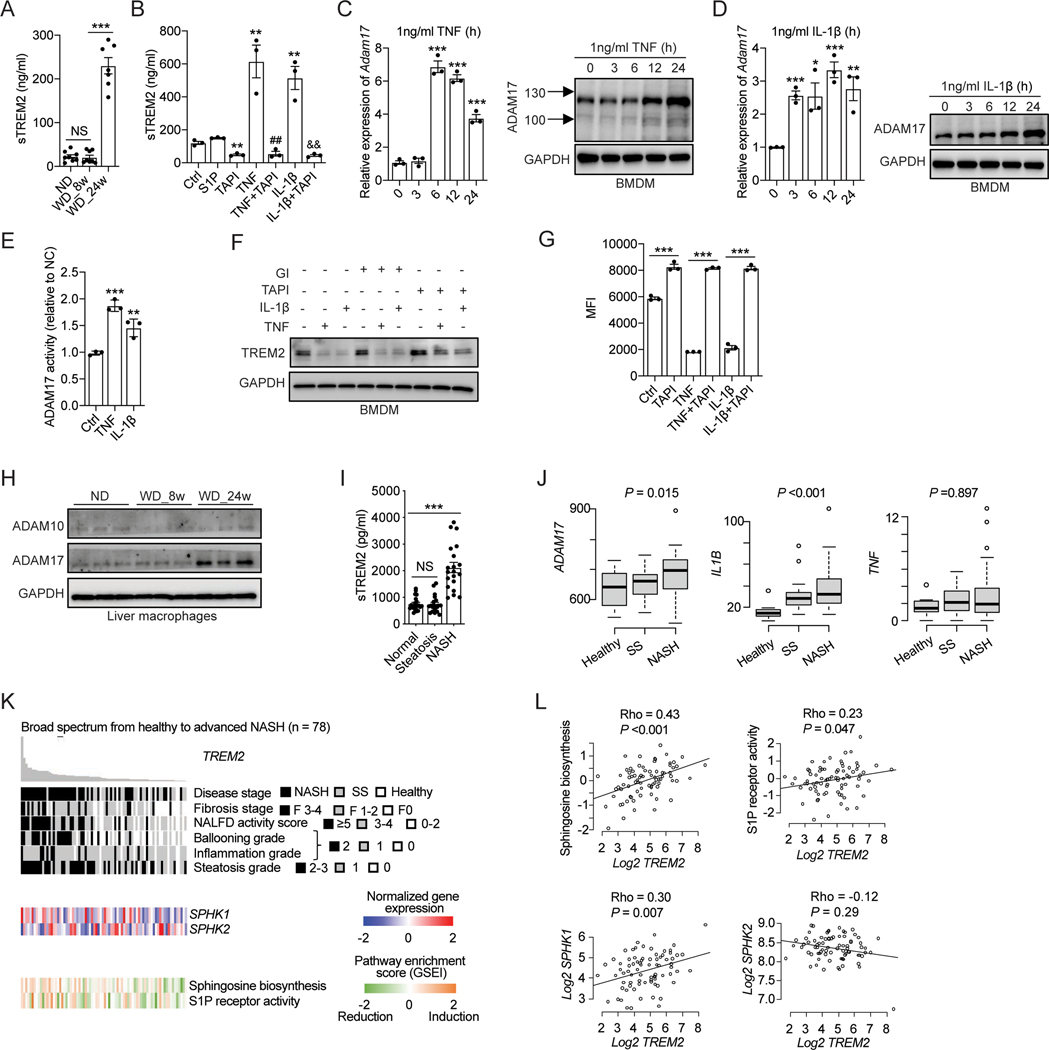
Figure 4. TNF and IL-1β induce TREM2 proteolytic cleavage by activating ADAM17.
(A) ELISA analysis of sTREM2 in mouse sera of C57BL/6 mice. ND, n = 8 mice; WD_8w, n = 8 mice; or WD_24w, n = 7 mice.
(B) ELISA analysis of sTREM2 in cell culture medium from BMDMs treated with indicated stimuli for 24 hours. S1P (500 nM), TAPI (ADAM17 inhibitor, 10 μM) TNF or IL-1β (1 ng/ml). **p < 0.01 vs. Ctrl group; ##p < 0.01 vs. TNF treated group; &&p < 0.01 vs. IL-1β treated group.
(C and D) RT-qPCR analysis of Adam17 mRNA and immunoblot analysis of ADAM17 in BMDMs stimulated with TNF (C) or IL-1β (D).
(E) Relative ADAM17 activity was quantified in BMDMs after 24 hours of TNF (1 ng/ml) or IL-1β (1 ng/ml) stimulation.
(F) Immunoblot analysis of TREM2 in BMDMs treated with 10 μM TAPI (an ADAM17 inhibitor) or 20 μM GI (an ADAM10 inhibitor) in combination with 1 ng/ml of TNF or IL-1β for 24 hours.
(G) Flow cytometry analysis of cell surface TREM2 in BMDMs pretreated with 10 μM TAPI followed by stimulation with 1 ng/ml of TNF or IL-1β for 24 hours. MFI was used for flow cytometry analysis.
(H) Immunoblot analysis of ADAM10 and ADAM17 in primary liver macrophages isolated from C57BL/6 mice.
(I) ELISA analysis of sTREM2 in human plasma from individuals with healthy, steatosis, and NASH livers (n = 20 subjects per group).
(J) Relative mRNA expression of ADAM17, IL-1B, and TNF in human liver tissue in a clinical cohort (GSE130970, n = 78). Healthy, n = 6; simple steatosis (SS), n = 14; NASH, n = 58.
(K and L) Association of TREM2 expression in human liver tissue with their pathohistological annotations, SPHK1 and SPHK2 expression, Sphingosine biosynthesis, and S1P receptor activity in a clinical cohort of NAFLD patients (GSE130970, n = 78).
Data are shown as mean ± s.e.m.. *p<0.05; **p<0.01; ***p<0.001; NS, not significant. All in vitro experiments were repeated independently at least three times. See also Figure S4 and Table S3.

