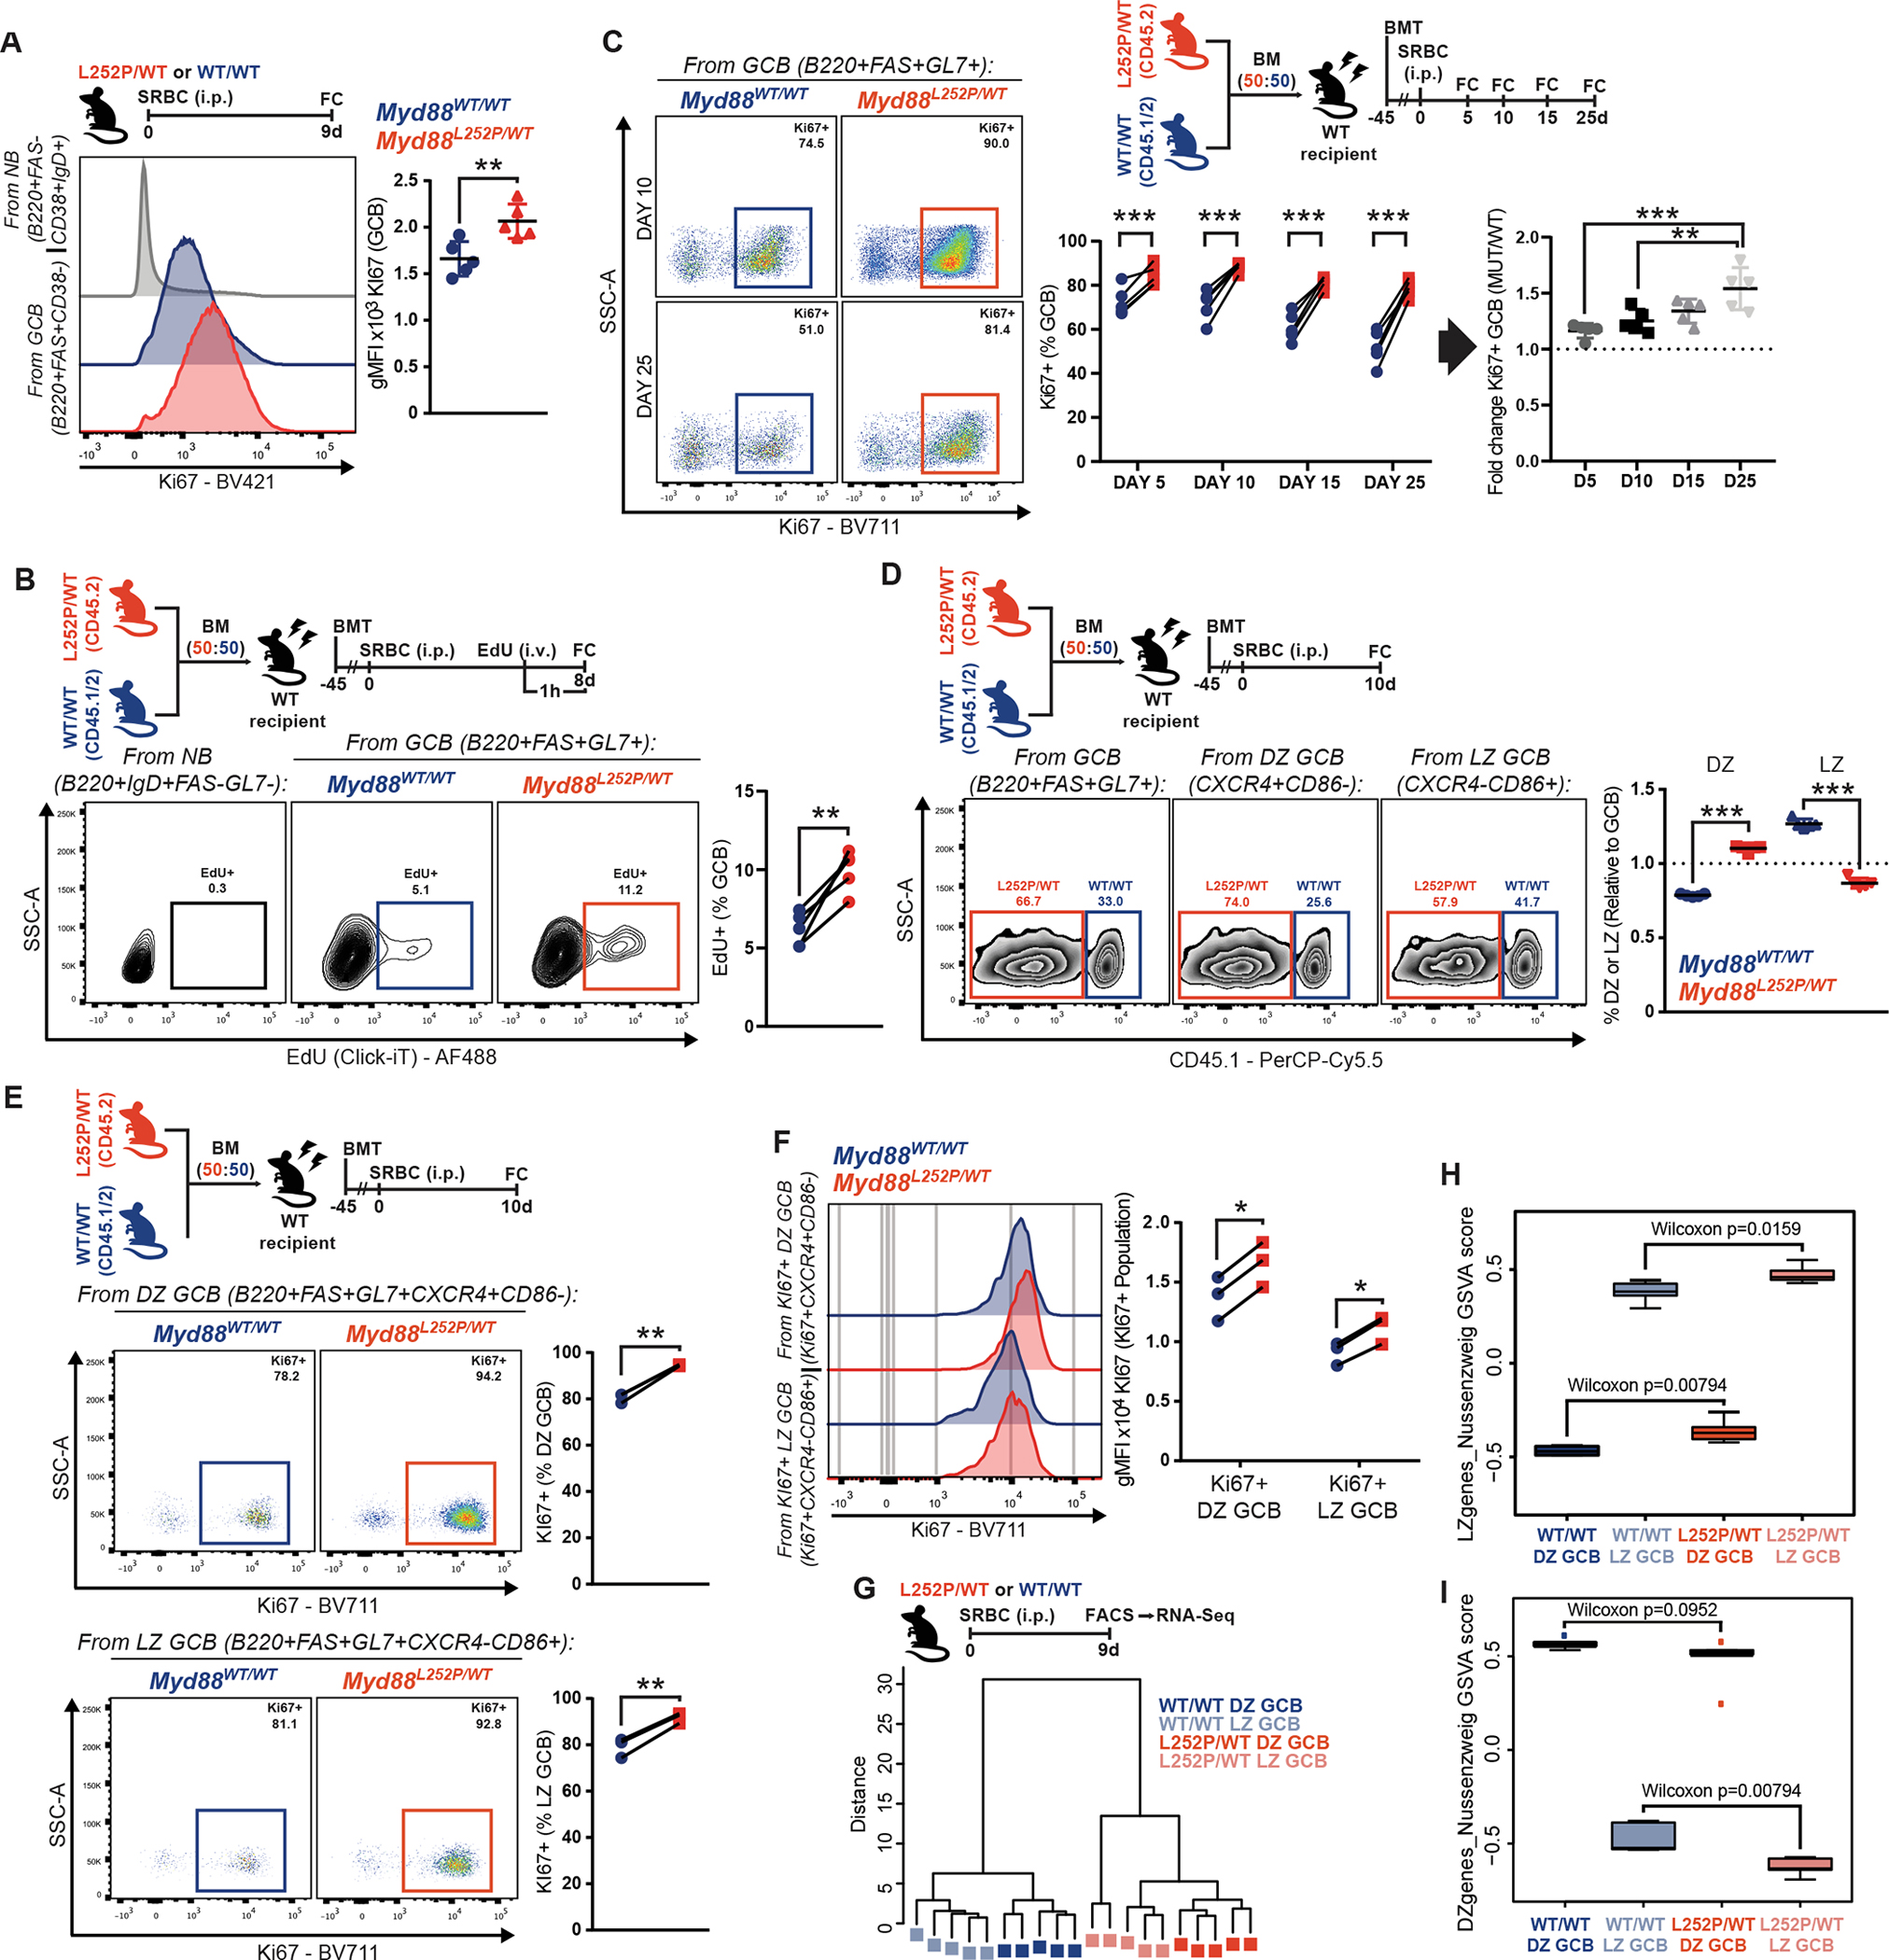
Figure 2. Myd88 mutations confer a proliferative advantage to GCB.

A, Geometric mean fluorescence intensity (gMFI) of Ki67 in splenic GCB.
B, FC analysis of EdU incorporation by GCB. NB illustrate non-proliferating cells.
C, FC analysis of Ki67+ GCB.
D, FC analysis of Myd88L252P/WT and Myd88WT/WT relative contribution to total, DZ or LZ GCB.
E, FC analysis of Ki67+ DZ and LZ GCB from (D).
F, FC analysis of Ki67 expression in Ki67+ DZ and LZ GCB from (E).
G, Hierarchical clustering, based on Euclidean distance, for RNA-Seq samples from sorted GCB.
H-I, GSVA analysis for samples in (G), relative to canonical (H) LZ or (I) DZ GCB signatures (GSE38696).
Values represent mean ± SEM. P-values calculated using unpaired (A,D) or paired (B,C,E,F) two-tailed Student’s t-test with the two-stage step-up method of Benjamini, Krieger and Yekutieli where applicable.
