
Figure 3. Myd88 mutations lower the requirement for T-cell-derived co-stimulatory signals.
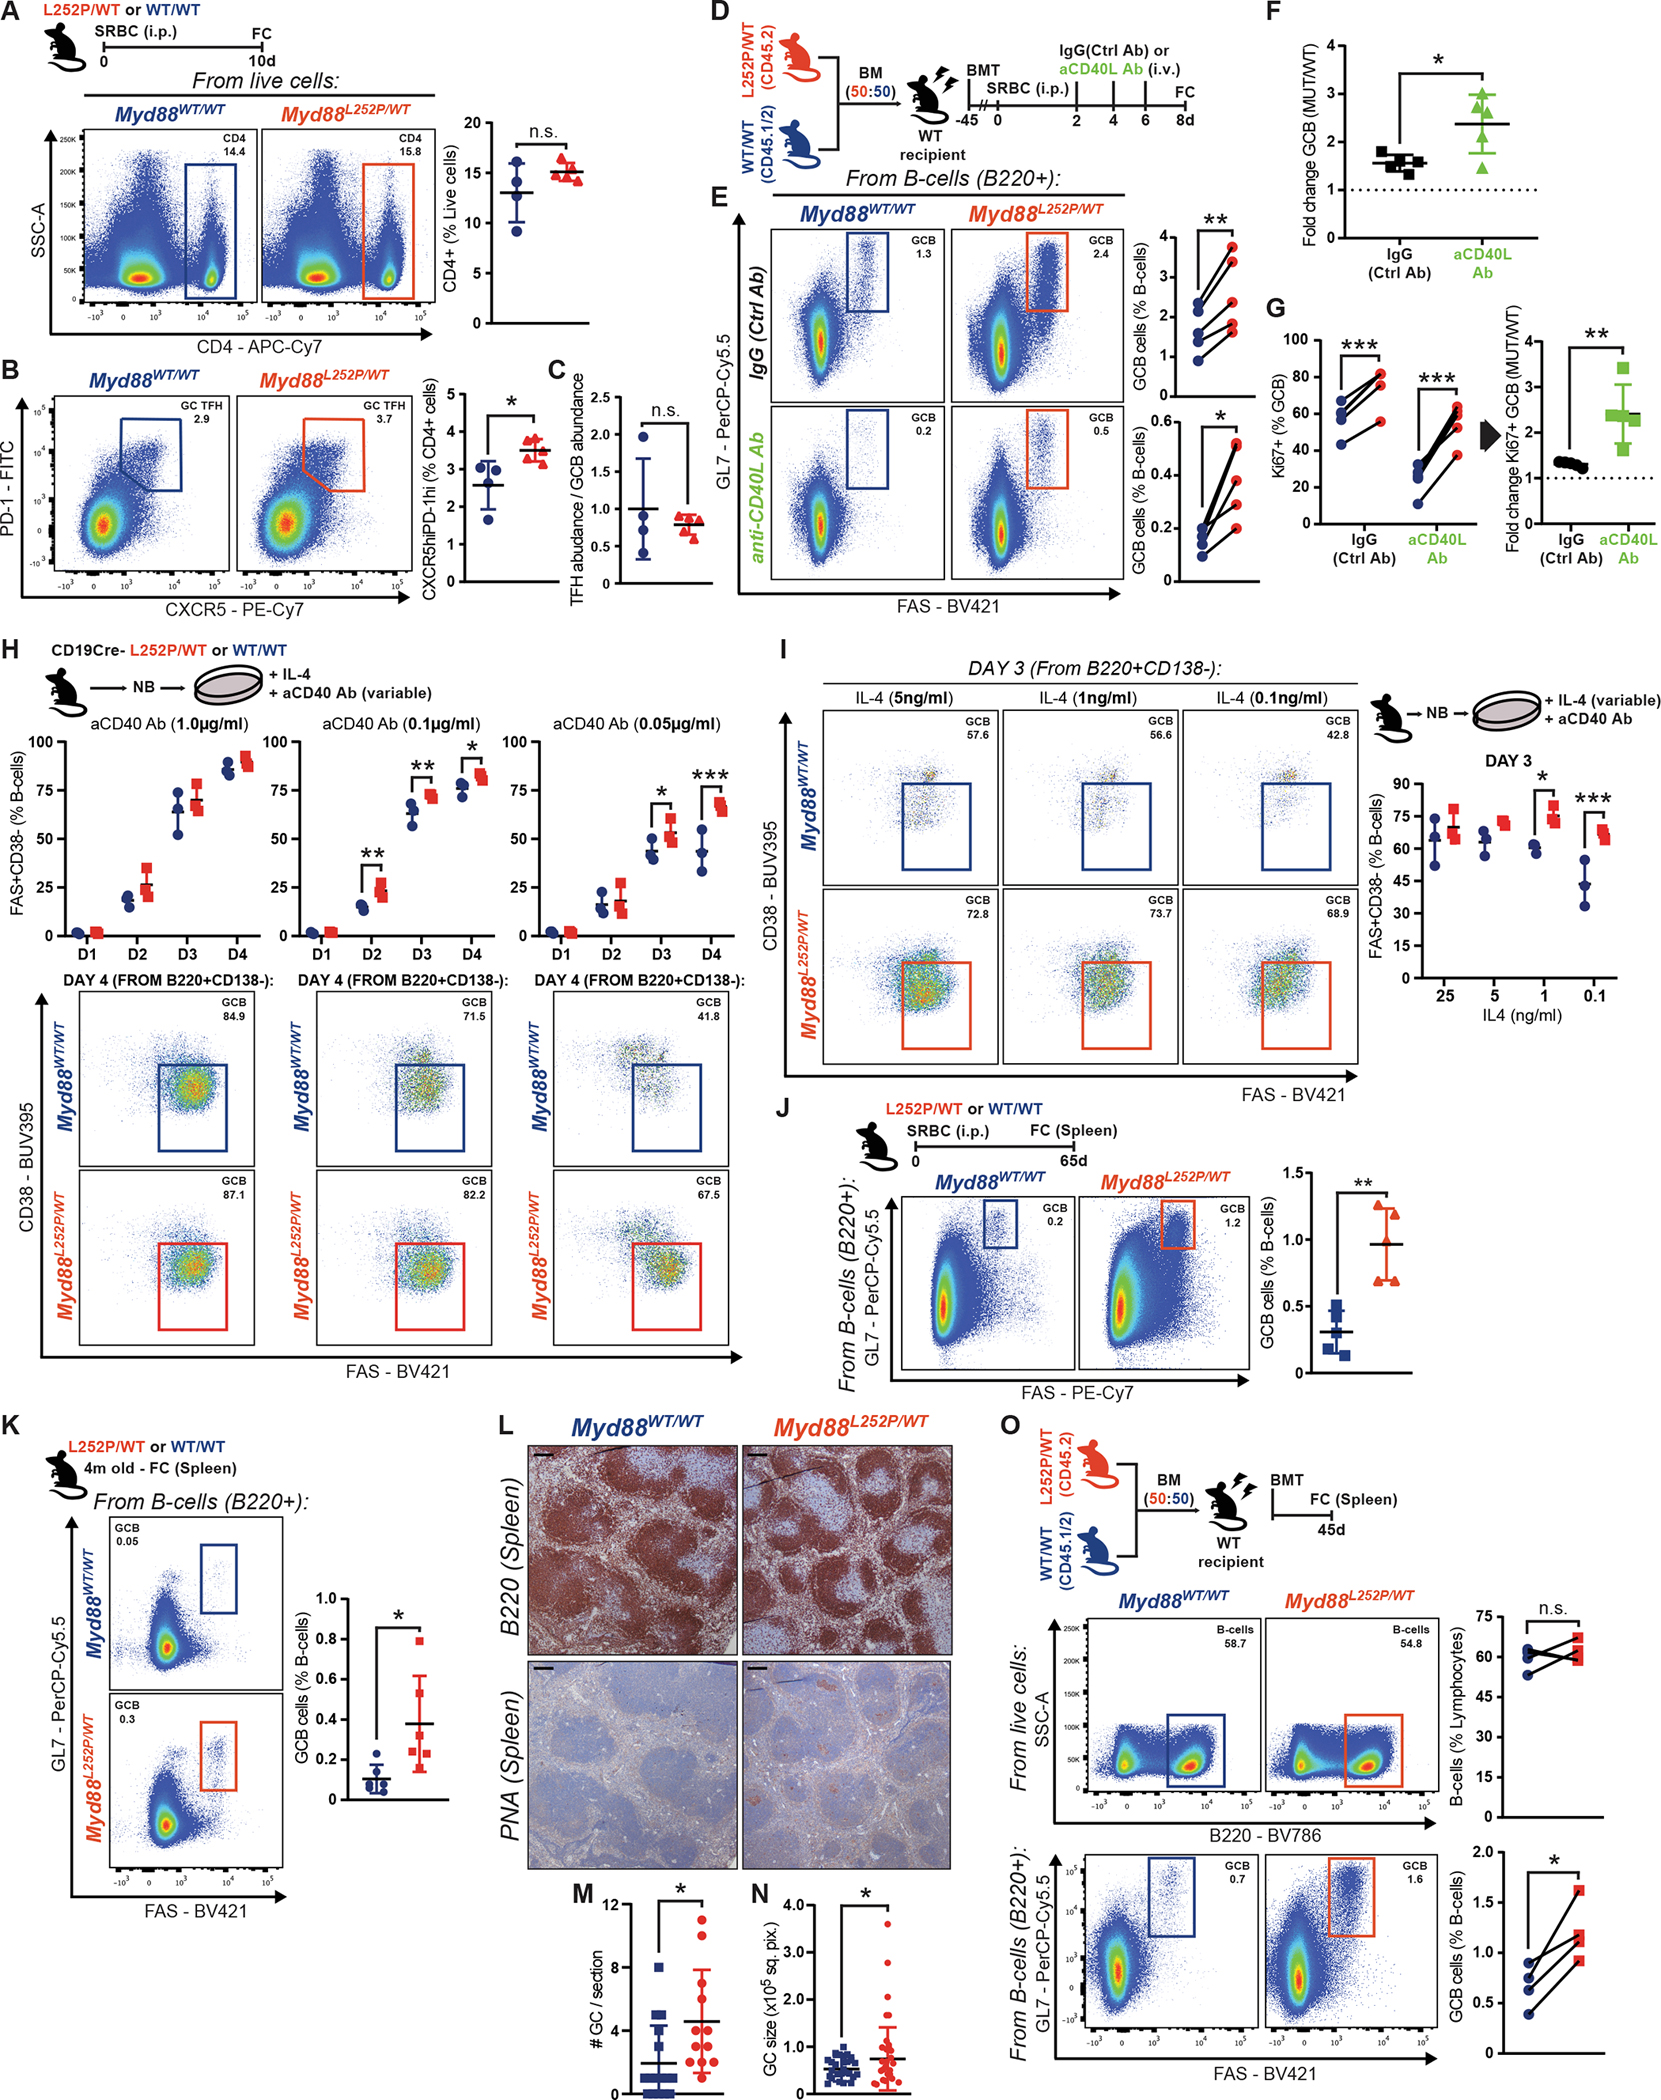
A-C, FC analysis of (A) CD4+ or (B) GC TFH cells. (C) GC TFH abundance relative to GCB in the same animals.
D, Experimental scheme for E-G.
E-F, FC analysis of GCB as (E) percentage of B-cells or (F) change between conditions.
G, FC analysis of Ki67 expression in GCB from (E).
H-I, FC analysis of iGCB with variable (H) CD40 or (I) IL-4 stimulation.
J, FC analysis of splenic GCB.
K, FC analysis of GCB in non-immunized mice.
L, B220 and PNA IHC in consecutive sections from animals treated as in K. Scale = 100μm.
M-N, GC (M) numbers or (N) individual area in naive mice. Dots represent individual (M) animals or (N) GCs. Results for 12–18 animals per genotype, from 2 experiments.
O, FC analysis of Myd88L252P/WT and Myd88WT/WT relative contribution to B-cells and GCB.
Values represent mean ± SEM. P-values calculated using unpaired (A-C,F,G,J,K) or paired (E,G,O) two-tailed Student’s t-test; or Mann-Whitney U-test (M,N); or two-way ANOVA with Tukey’s post-test (H,I).