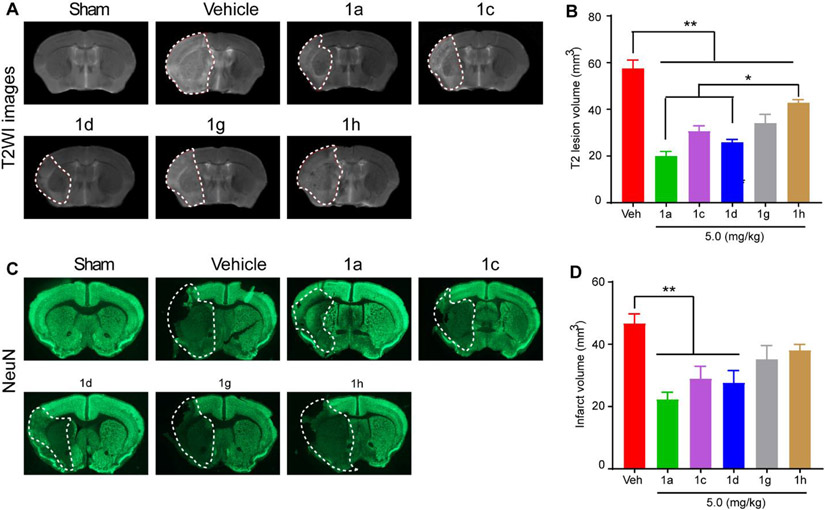
Fig. 2. Effects off ZT-1a derivatives on reducing stroke-induced infarction.
(A) Representative images of MRI T2WI maps of ex vivo brains from Sham, Vehicle (Veh)-treated, ZT-1a-treated, ZT-1d-treated, and ZT-1h-treated mice at 7-day post-stroke. (B) Quantitative analysis of T2WI lesion volume in each group. Data are mean ±SEM; n = 4 (sham), 6 (veh), 5 (1a), 6 (1c), 6 (1d), 6 (1g) and 6 (1h). (C) Representative brain section images with immunofluorescence staining of NeuN. (D) Quantitative analysis of lesion volume assessed by NeuN immunofluorescence intensity. Data are mean ±SEM; n = 4 (sham), 6 (veh), 5 (1a), 6 (1c), 6 (1d), 6 (1g) and 6 (1h). *p < 0.05 vs. Veh; **p < 0.01 vs. Veh.

