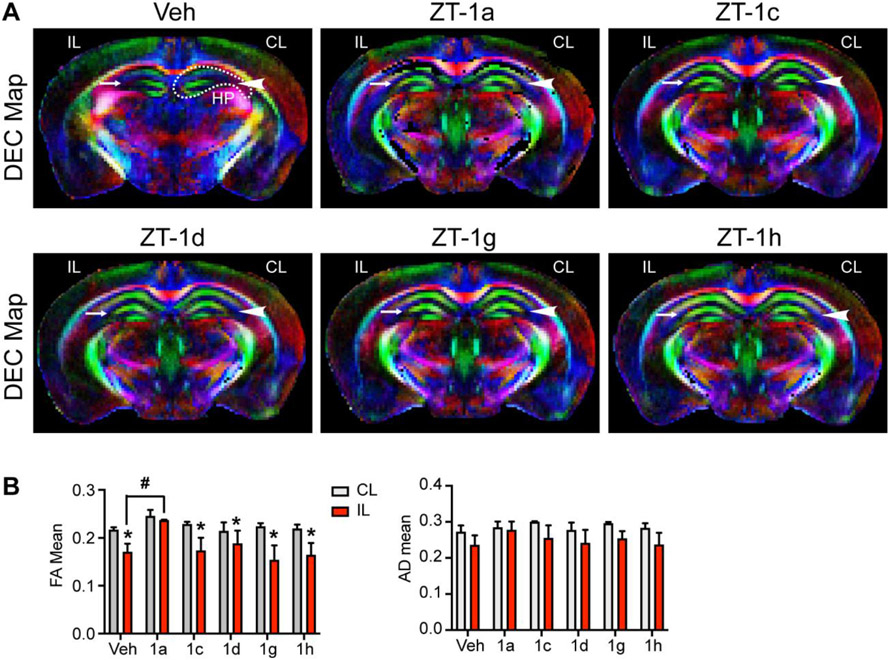
Fig. 4. Effects of ZT-1a derivatives on preserving hippocampus integrity of stroke brains.
(A) Representative images of DTI DEC maps of ex vivo brains from Veh-treated, ZT-1a-treated, ZT-1c-treated, ZT-1d-treated, ZT-1g-treated, and ZT-1h-treated mice at day 7 post-stroke. Arrow-head: intact hippocampus (HP); Arrow: damaged HP. dotted line: region of interest of HP. (B) Quantitative analysis of FA and AD of HP. Data are mean ±SEM; n = 3 (sham), 6 (veh), 3 (1a), 3 (1c), 4 (1d), 3 (1g) and 5 (1h); *p < 0.05 vs. CL; #p < 0.05 vs. Veh IL.

