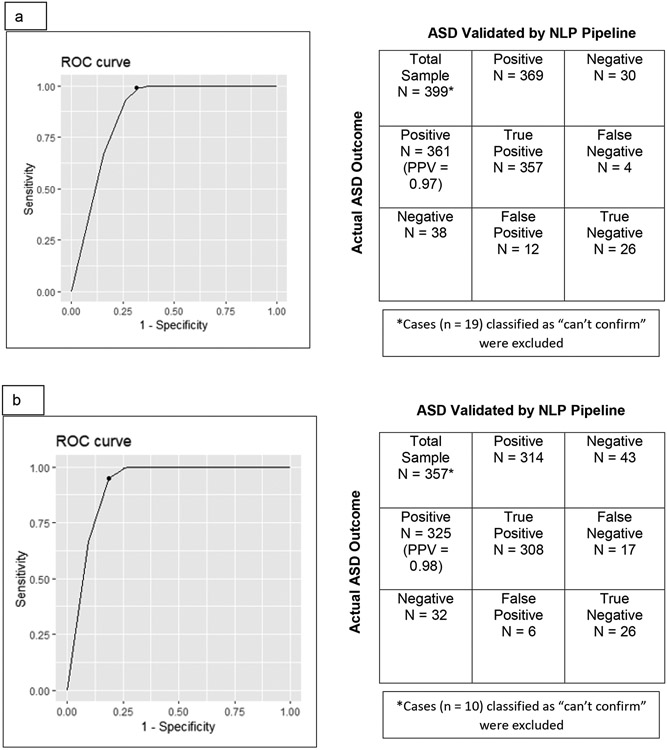
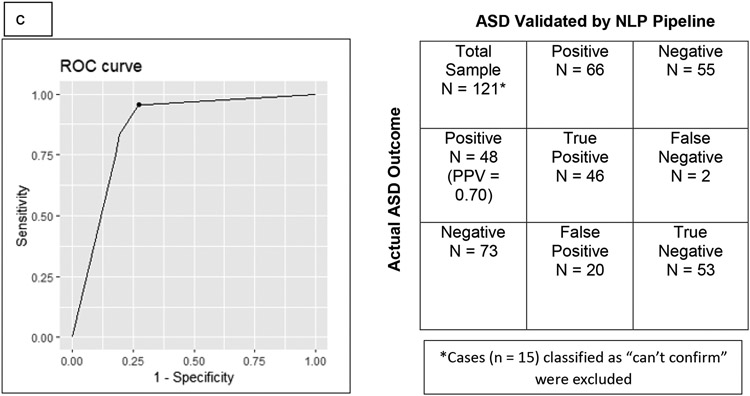
Figure 4.
Receiver-Operator (ROC) curves, accompanied by confusion matrices (indicate positive and negative cases), were constructed for each Cohort. Figure 4a shows the ROC curve and confusion matrix for all charts in Cohort 1. Figure 4b shows the ROC curve and confusion matrix for all charts in Cohort 1 containing four or more notes. Figure 4c shows the ROC curve and confusion matrix for all charts in Cohort 2. PPV = Positive Predictive Value.


