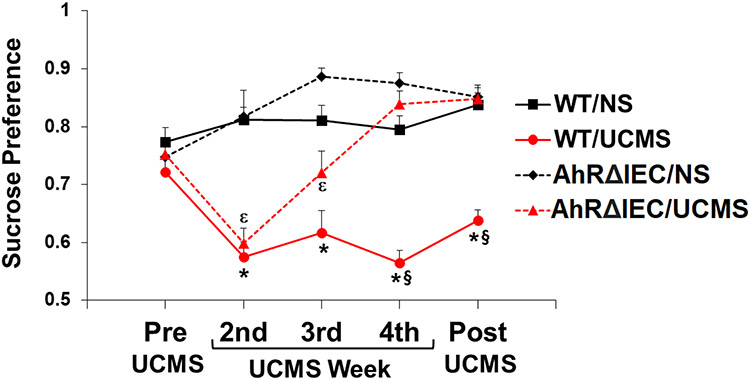
Fig 3. Differences in UCMS-induced anhedonia between AhRΔIEC and WT mice.
Mice were unstressed or subjected to UCMS for 4 weeks. Sucrose preference was monitored before starting UCMS, and at the end of the second, third and fourth week of UCMS, and 1 week post UCMS. WT/NS (n=10) – unstressed WT mice; WT/UCMS (n=10) – WT mice subjected to UCMS; AhRΔIEC/NS (n=7) – unstressed intestinal epithelium AhR KO mice; AhRΔIEC/UCMS (n=10) – intestinal epithelium AhR KO mice subjected to UCMS. (*) Bonferroni post hoc contrast indicates a significant difference from WT/NS (p < 0.05); (ε) Bonferroni post hoc contrast indicates a significant difference from AhRΔIEC7NS (p < 0.05) (§) Bonferroni post hoc contrast indicates a significant difference from AhRΔIEC/UCMS (p < 0.05). Results are presented as mean + SEM.

