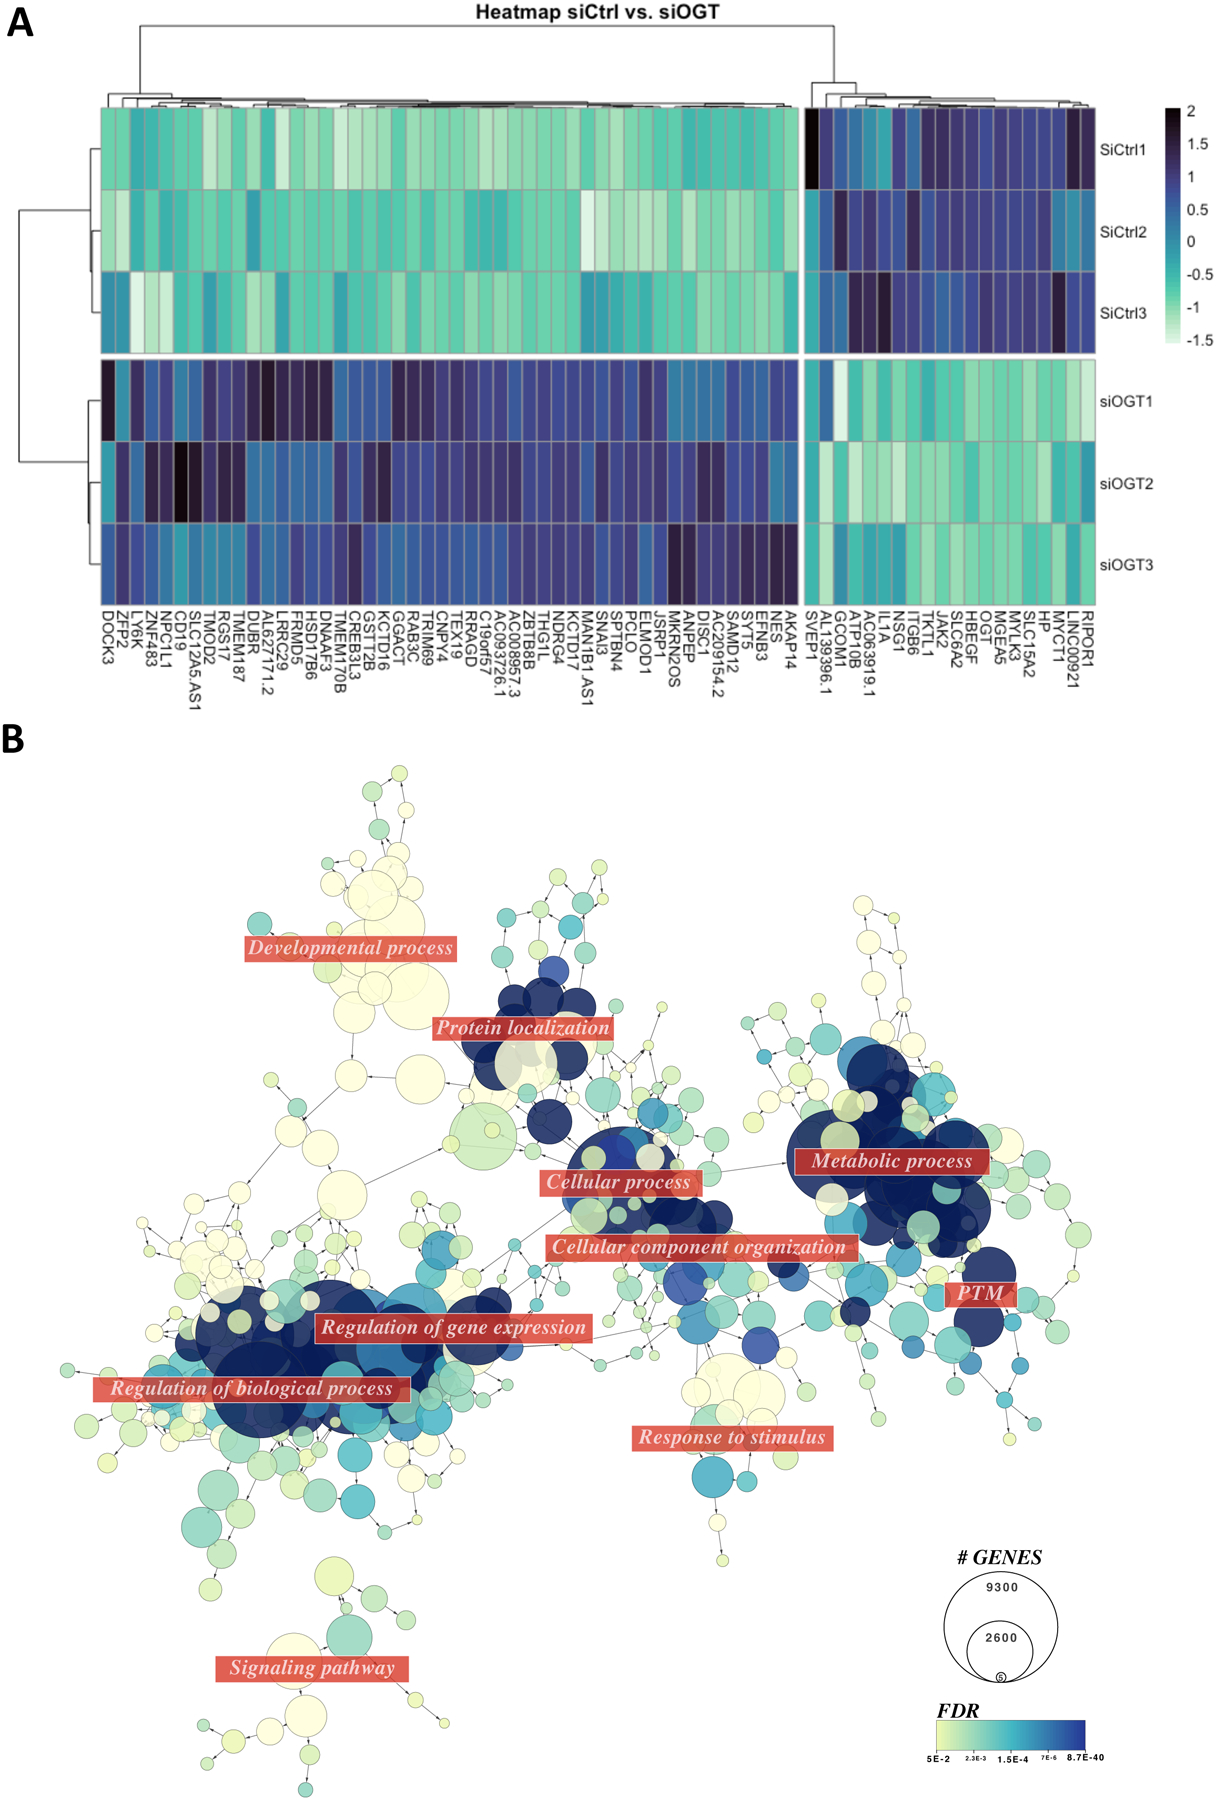
Figure 2: Modulating OGT in male placental cells leads to important changes in the transcriptome.

(A) Heatmap of the deregulated genes in siOGT vs. siCtrl Bewo cells. Genes shown have an adjPValue<0.05 and abs(Log2FC)>1 (n=3/group). (B) Network representation of enriched GO terms (FDR<0.05) using deregulated genes (AdjPValue<0.05) in siOGT vs. siCtrl Bewo Cells.
