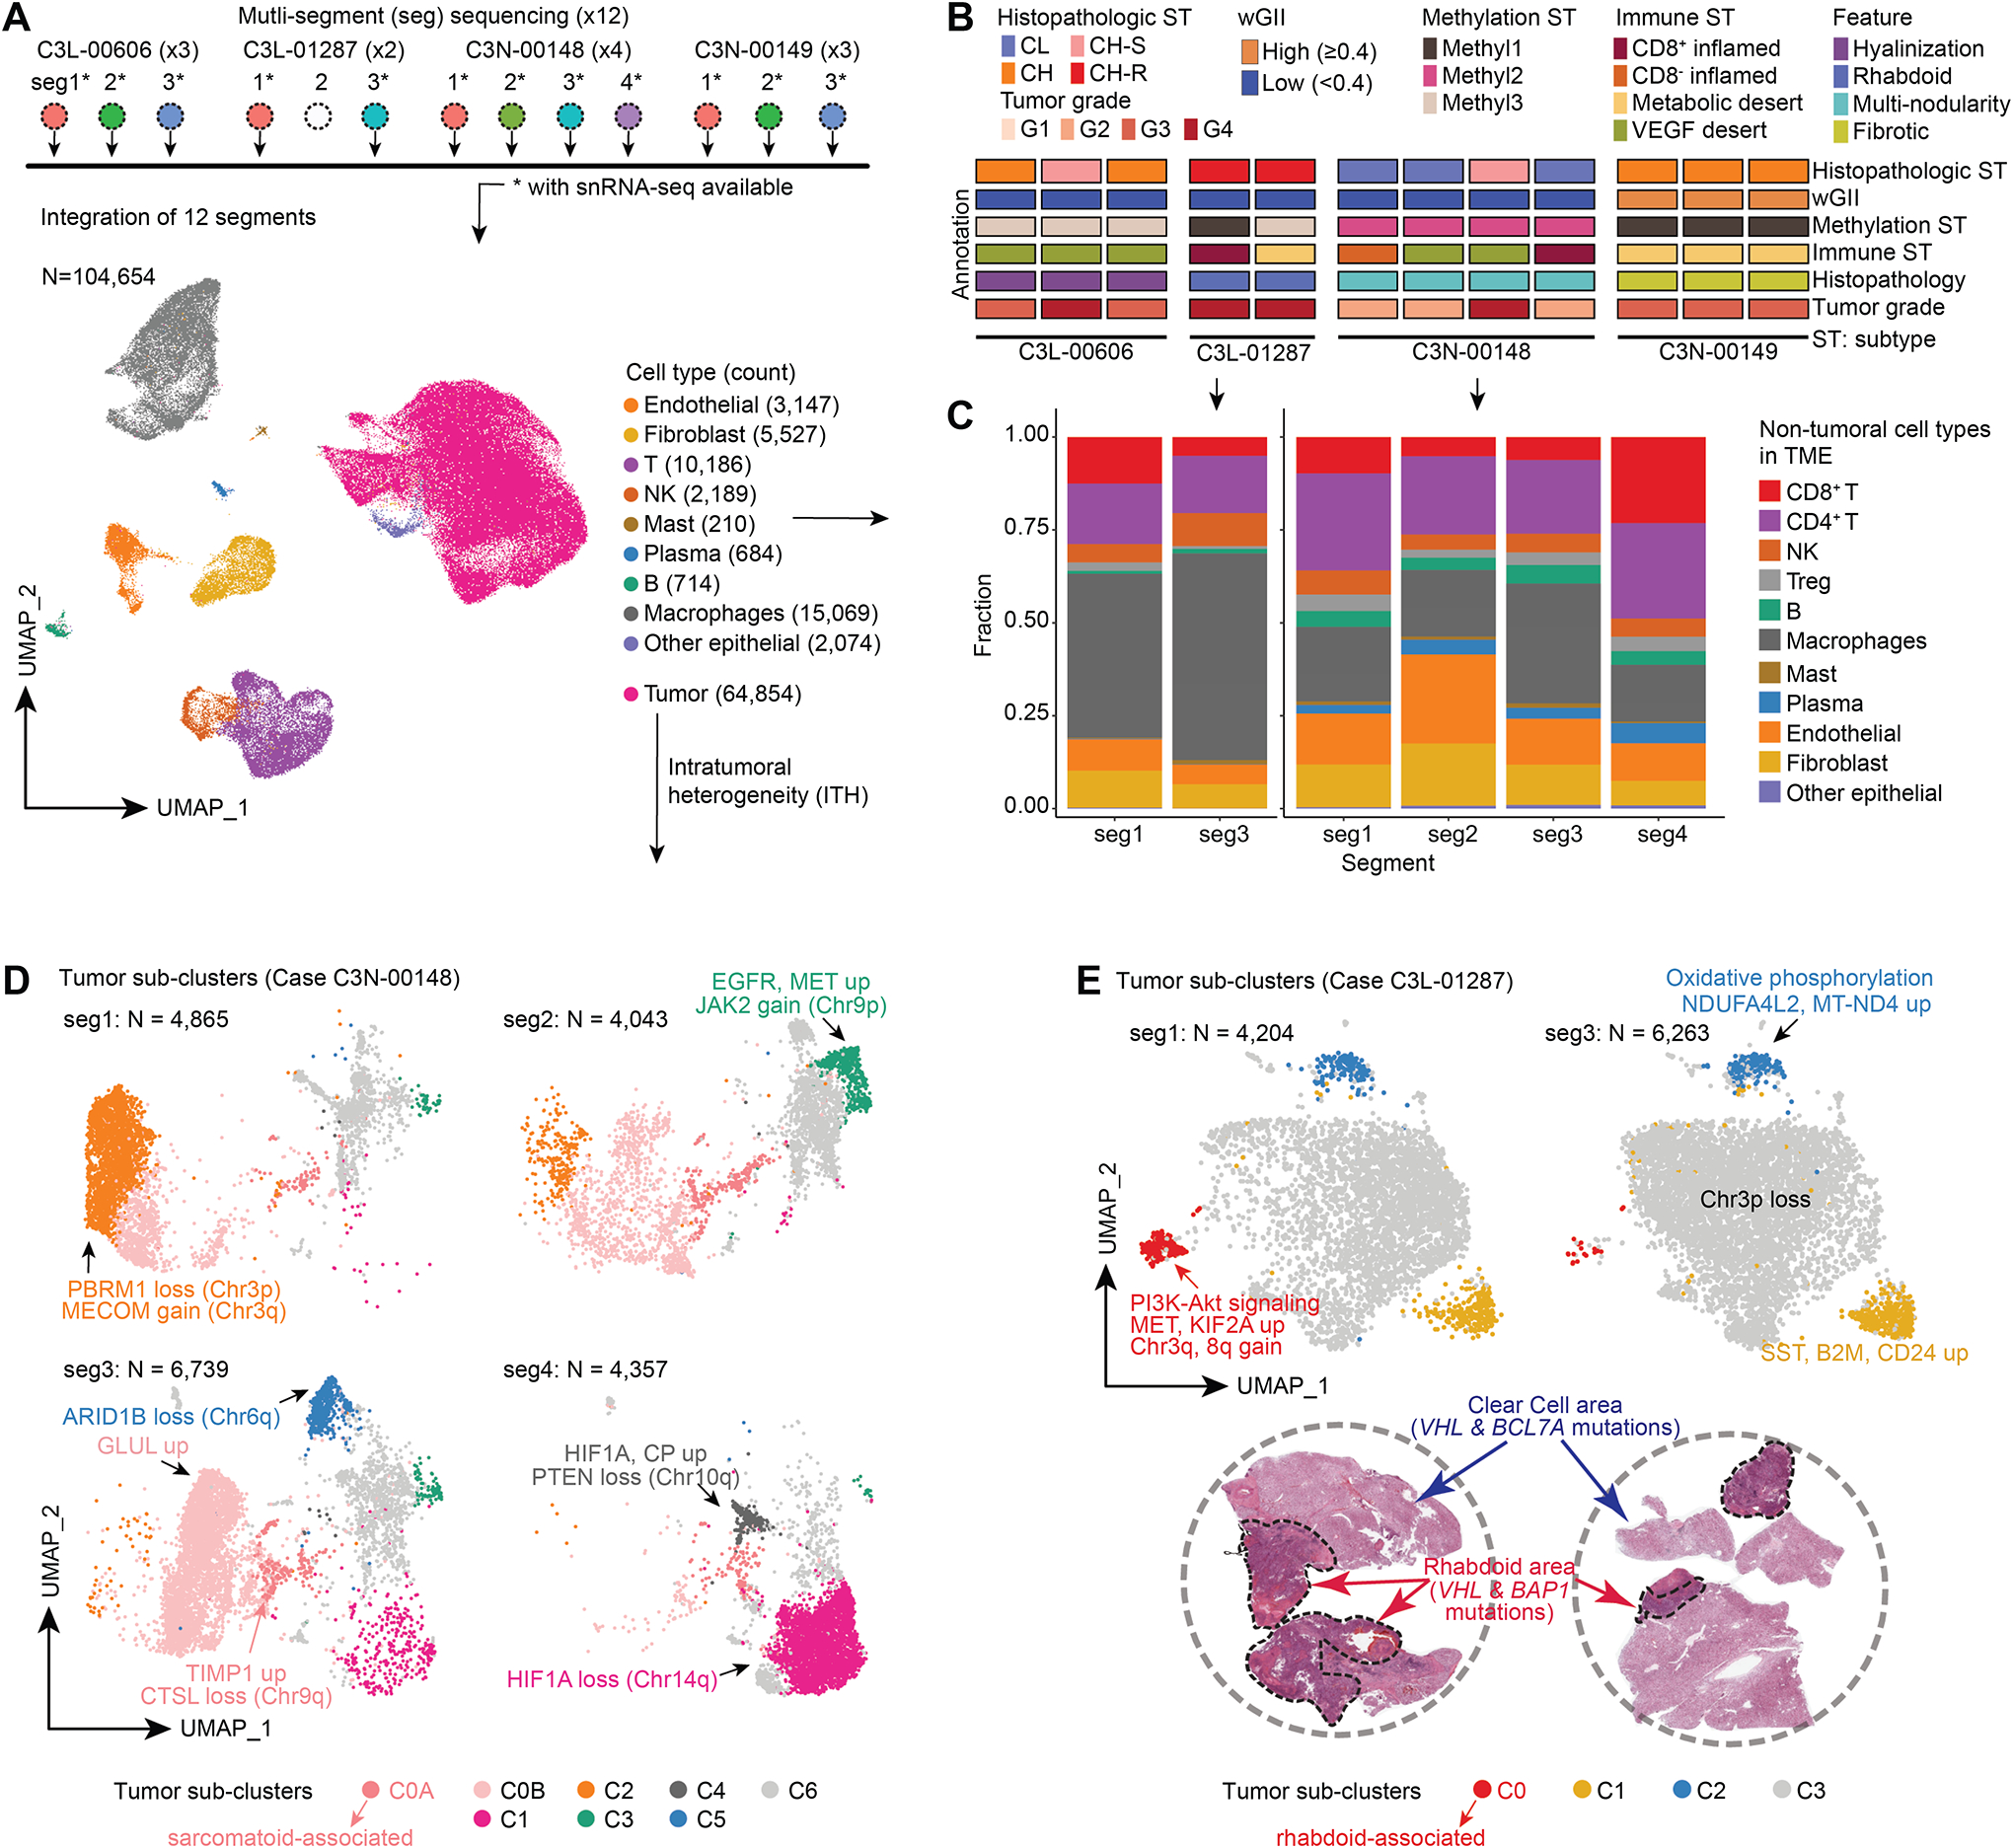
Figure 3. Single-nuclei RNA-seq atlas identifies distinct intra-tumor epithelial populations.

A) snRNA-seq analysis workflow schematic (Top). snRNA-seq cell atlas generated from 12 segments obtained from 4 cases (Bottom). The UMAP displays 26 cell clusters that were subsequently annotated as 10 different cell types.
B) Schematic tracks present the heterogeneity observed in the 12 segments at the histological and molecular characterizations.
C) Frequency and composition of non-tumoral cell types found in the TME in C3L-01287 and C3N-00148 with immune ITH.
D) UMAP shows the tumor sub-clusters and the corresponding ITH found in 4 segments obtained from C3N-00148 with critical molecular feature annotations indicated.
E) UMAP representation of tumor subclusters ITH in the 2 segments of C3L-01287 (Top). H&E reveals the presence of classic clear cell and mutually exclusive rhabdoid regions in this tumor (bottom). WES using dissected regions showed VHL mutation in clear cell region, and VHL and BAP1 mutations in rhabdoid region.
