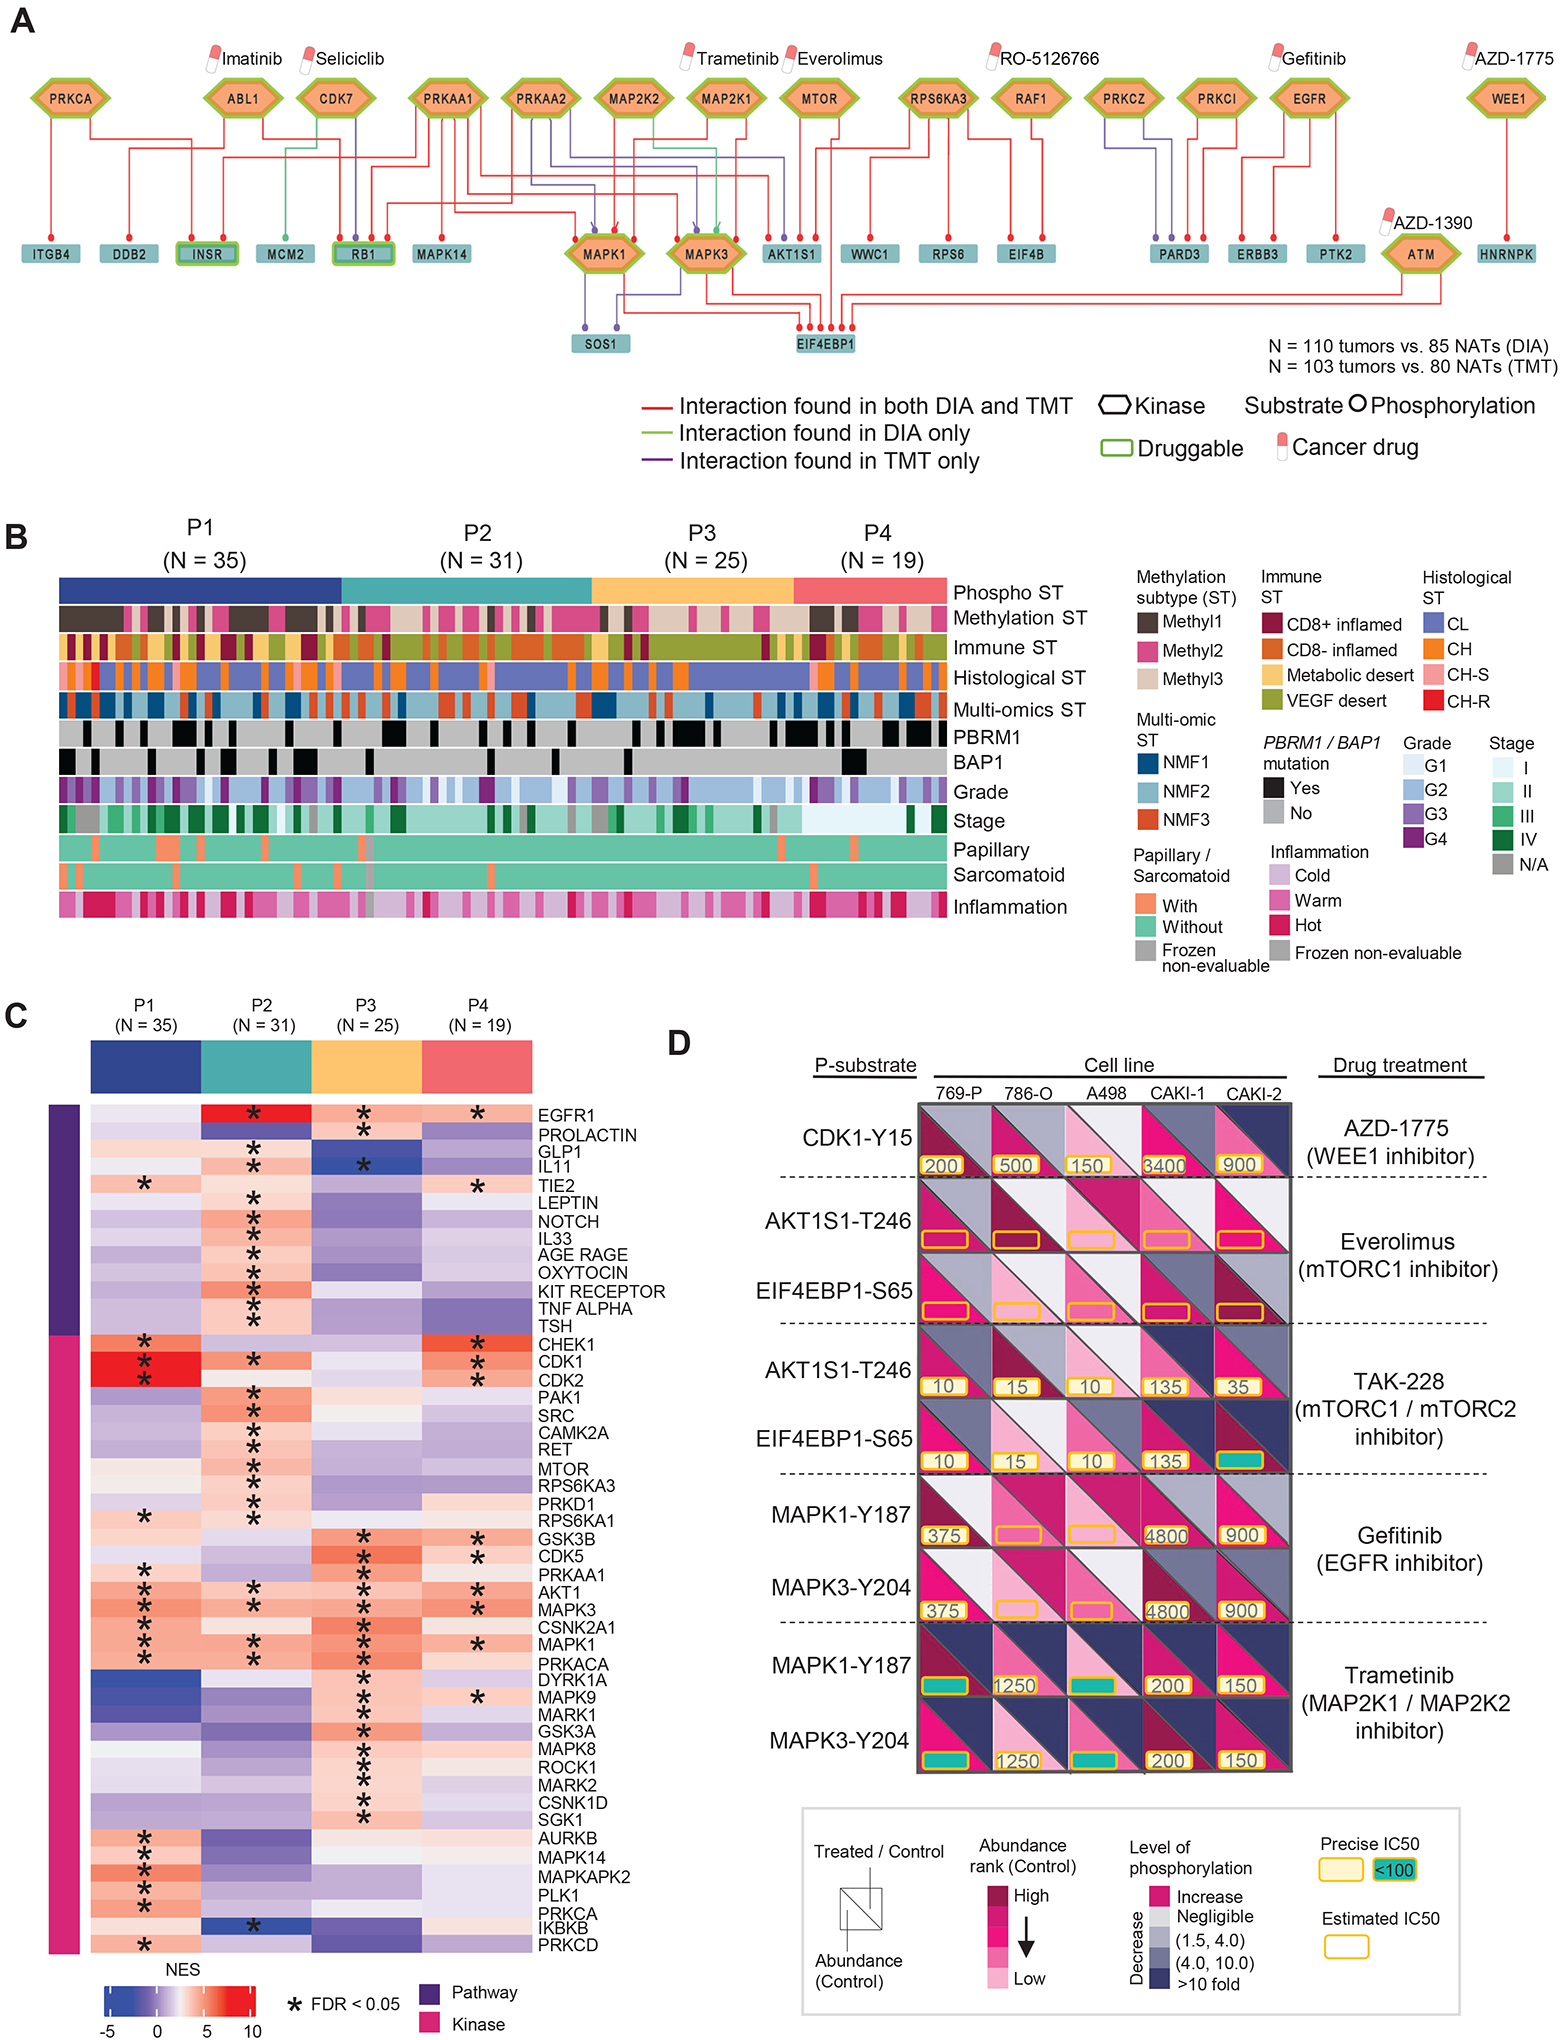
Figure 6. Identification of key phospho signaling pathways, kinase-substrate (K-S) interactions in ccRCC tissues, and integration of ex-vivo kinase drug inhibition data from RCC cell lines.

A) Top 50 signaling pathways of K-S pairs with the highest phospho-substrate abundance (tumors vs. NATs). The labeled cancer drugs are not exhaustive and they are either under investigation or FDA-approved.
B) Phosphoproteomic subtypes (P1–4) are overlaid with 11 variables from molecular, genetic, and histologic features shown as annotation tracks immediately below.
C) Pathways and kinase activities are inferred from phosphoproteomic data for each phospho subtype. NES: normalized enrichment score from PTM-SEA.
D) Schematic representation summarizing the kinase inhibition experiment conducted in five RCC cell lines targeting the kinases identified in our initial cohort. The phosphorylation level changes in the downstream substrates of targeted kinases indicate the response to the corresponding treatments relative to the control. Each cell line with one control and treated with five different kinase inhibitors.
