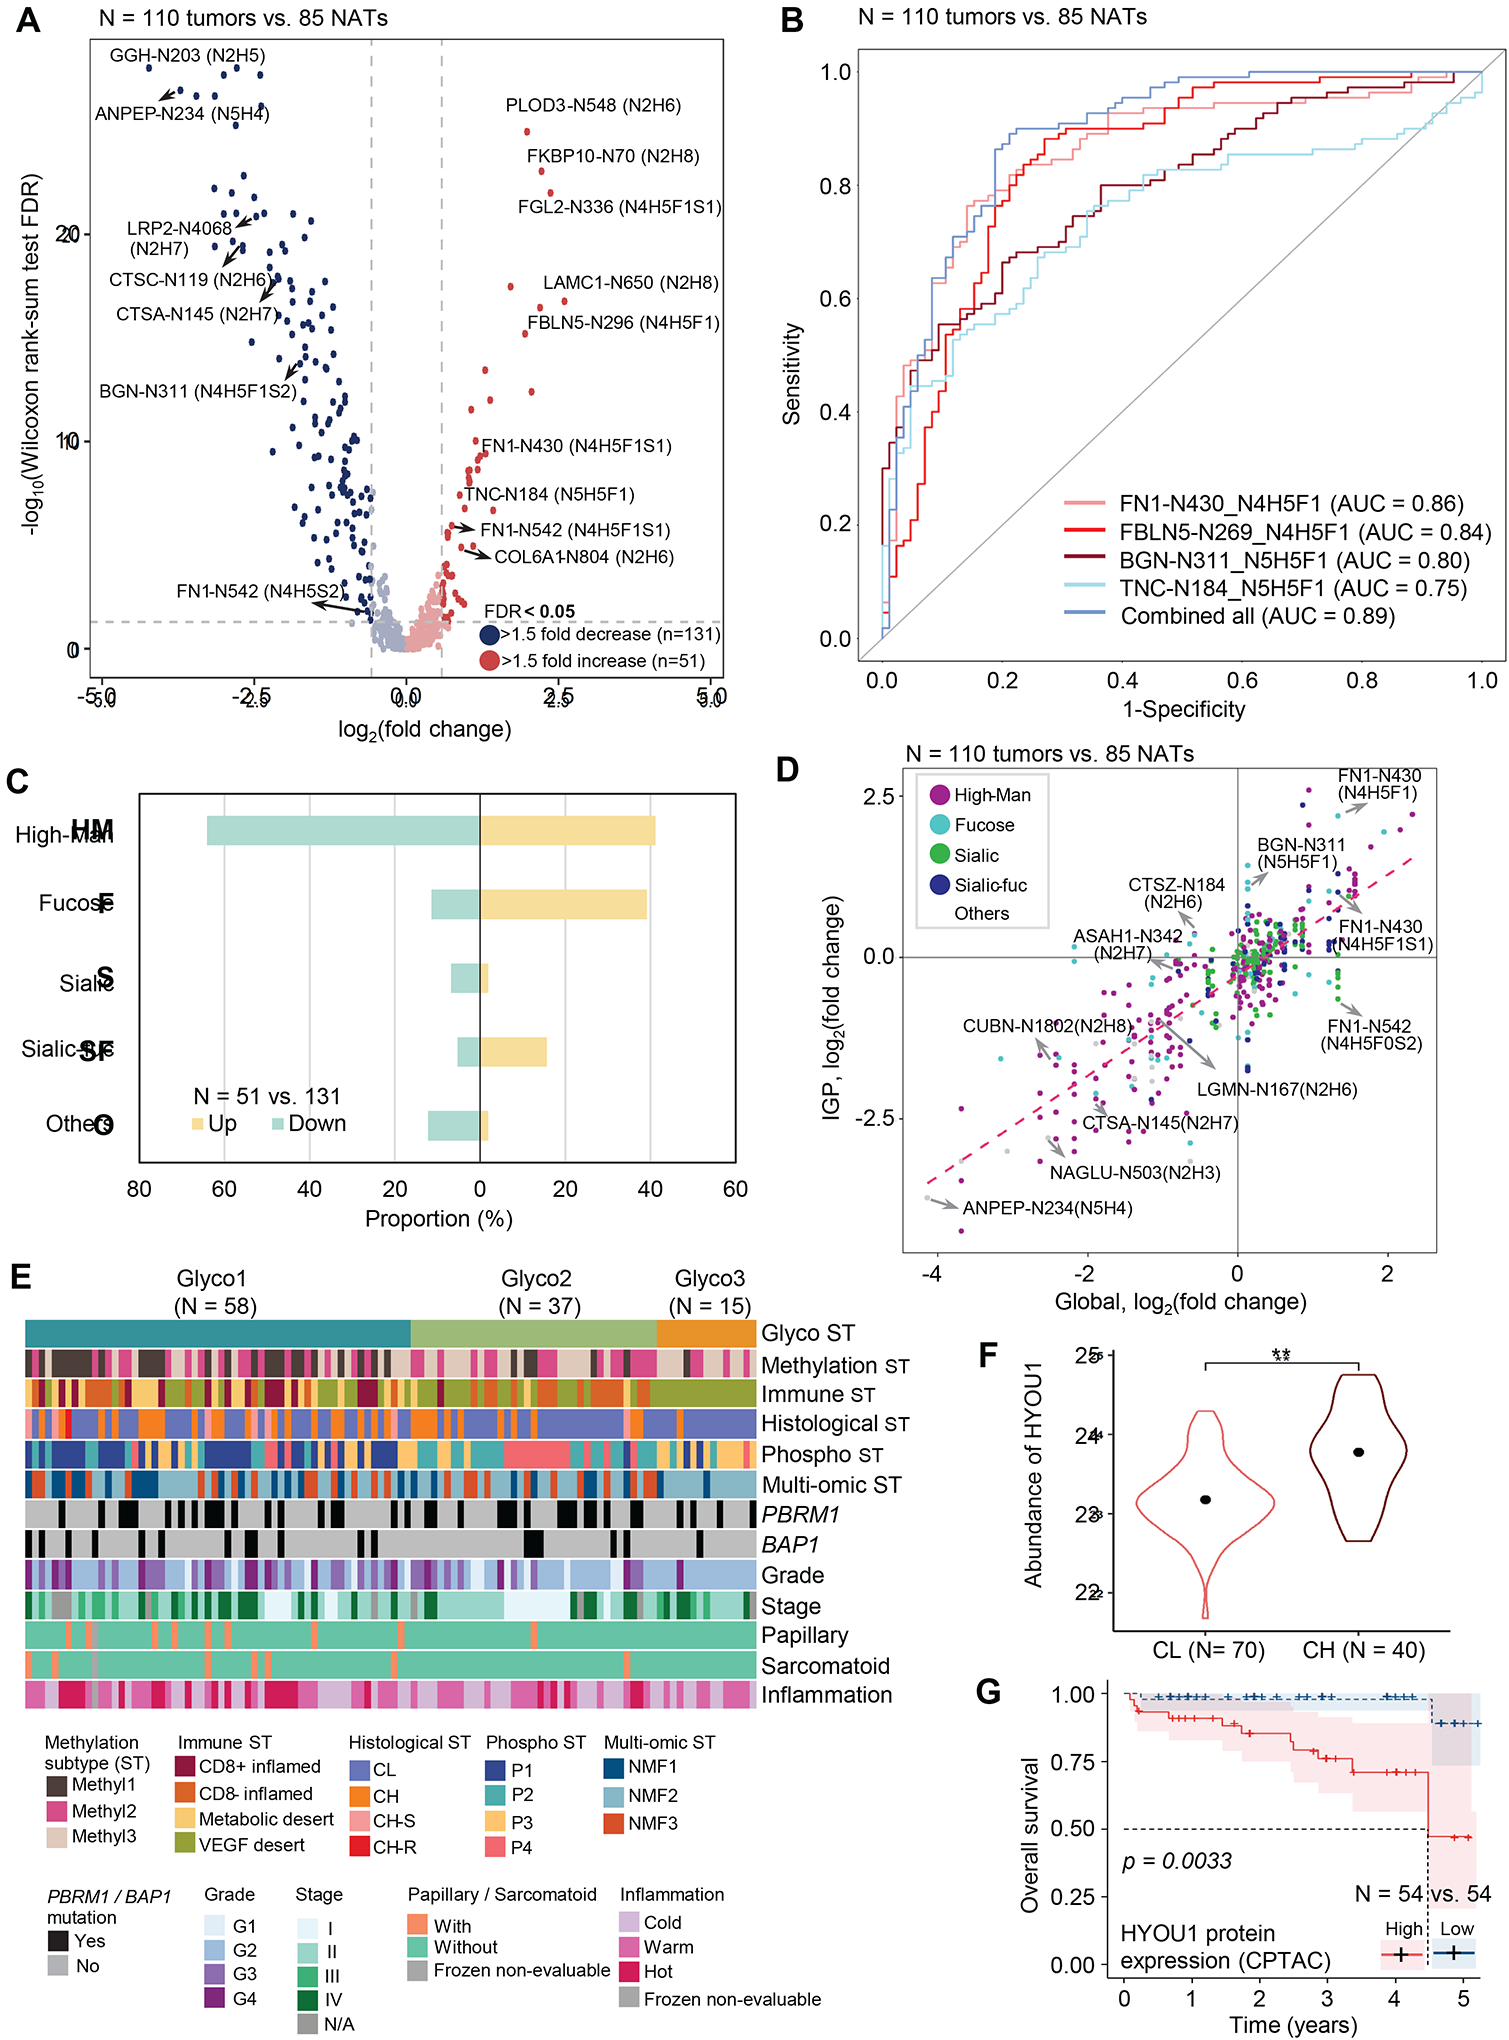
Figure 7. Alteration of protein glycosylation specific to ccRCC and high-grade ccRCC.

A) Volcano plot shows Intact glycopeptides (IGPs) differentially expressed between tumors and NATs.
B) Performance of glyco-signatures individually and as a multi-signature panel for differentiating tumor and non-tumor tissues.
C) Glycan type distribution of differentially expressed IGPs (tumors vs. NATs).
D) Glycosylation changes (y-axis) compared to global protein expression (x-axis) changes in tumors vs NATs.
E) Glycoproteomic subtypes (Glyco1–3) are overlaid with 12 variables represented by individual tracks immediately below.
F) Violin plot shows HYOU1 protein abundance between CL and CH tumors. ** indicates that Wilcoxon rank-sum test FDR < 0.01. Dots in the violin plots correspond to median abundance. The violin plot outlines demonstrate the kernel probability.
G) Kaplan Meier plot compares HYOU1 protein expression between High (upper quartile) and Low (lower quartile) groups in the CPTAC cohort. Log-rank test p is 0.0033.
