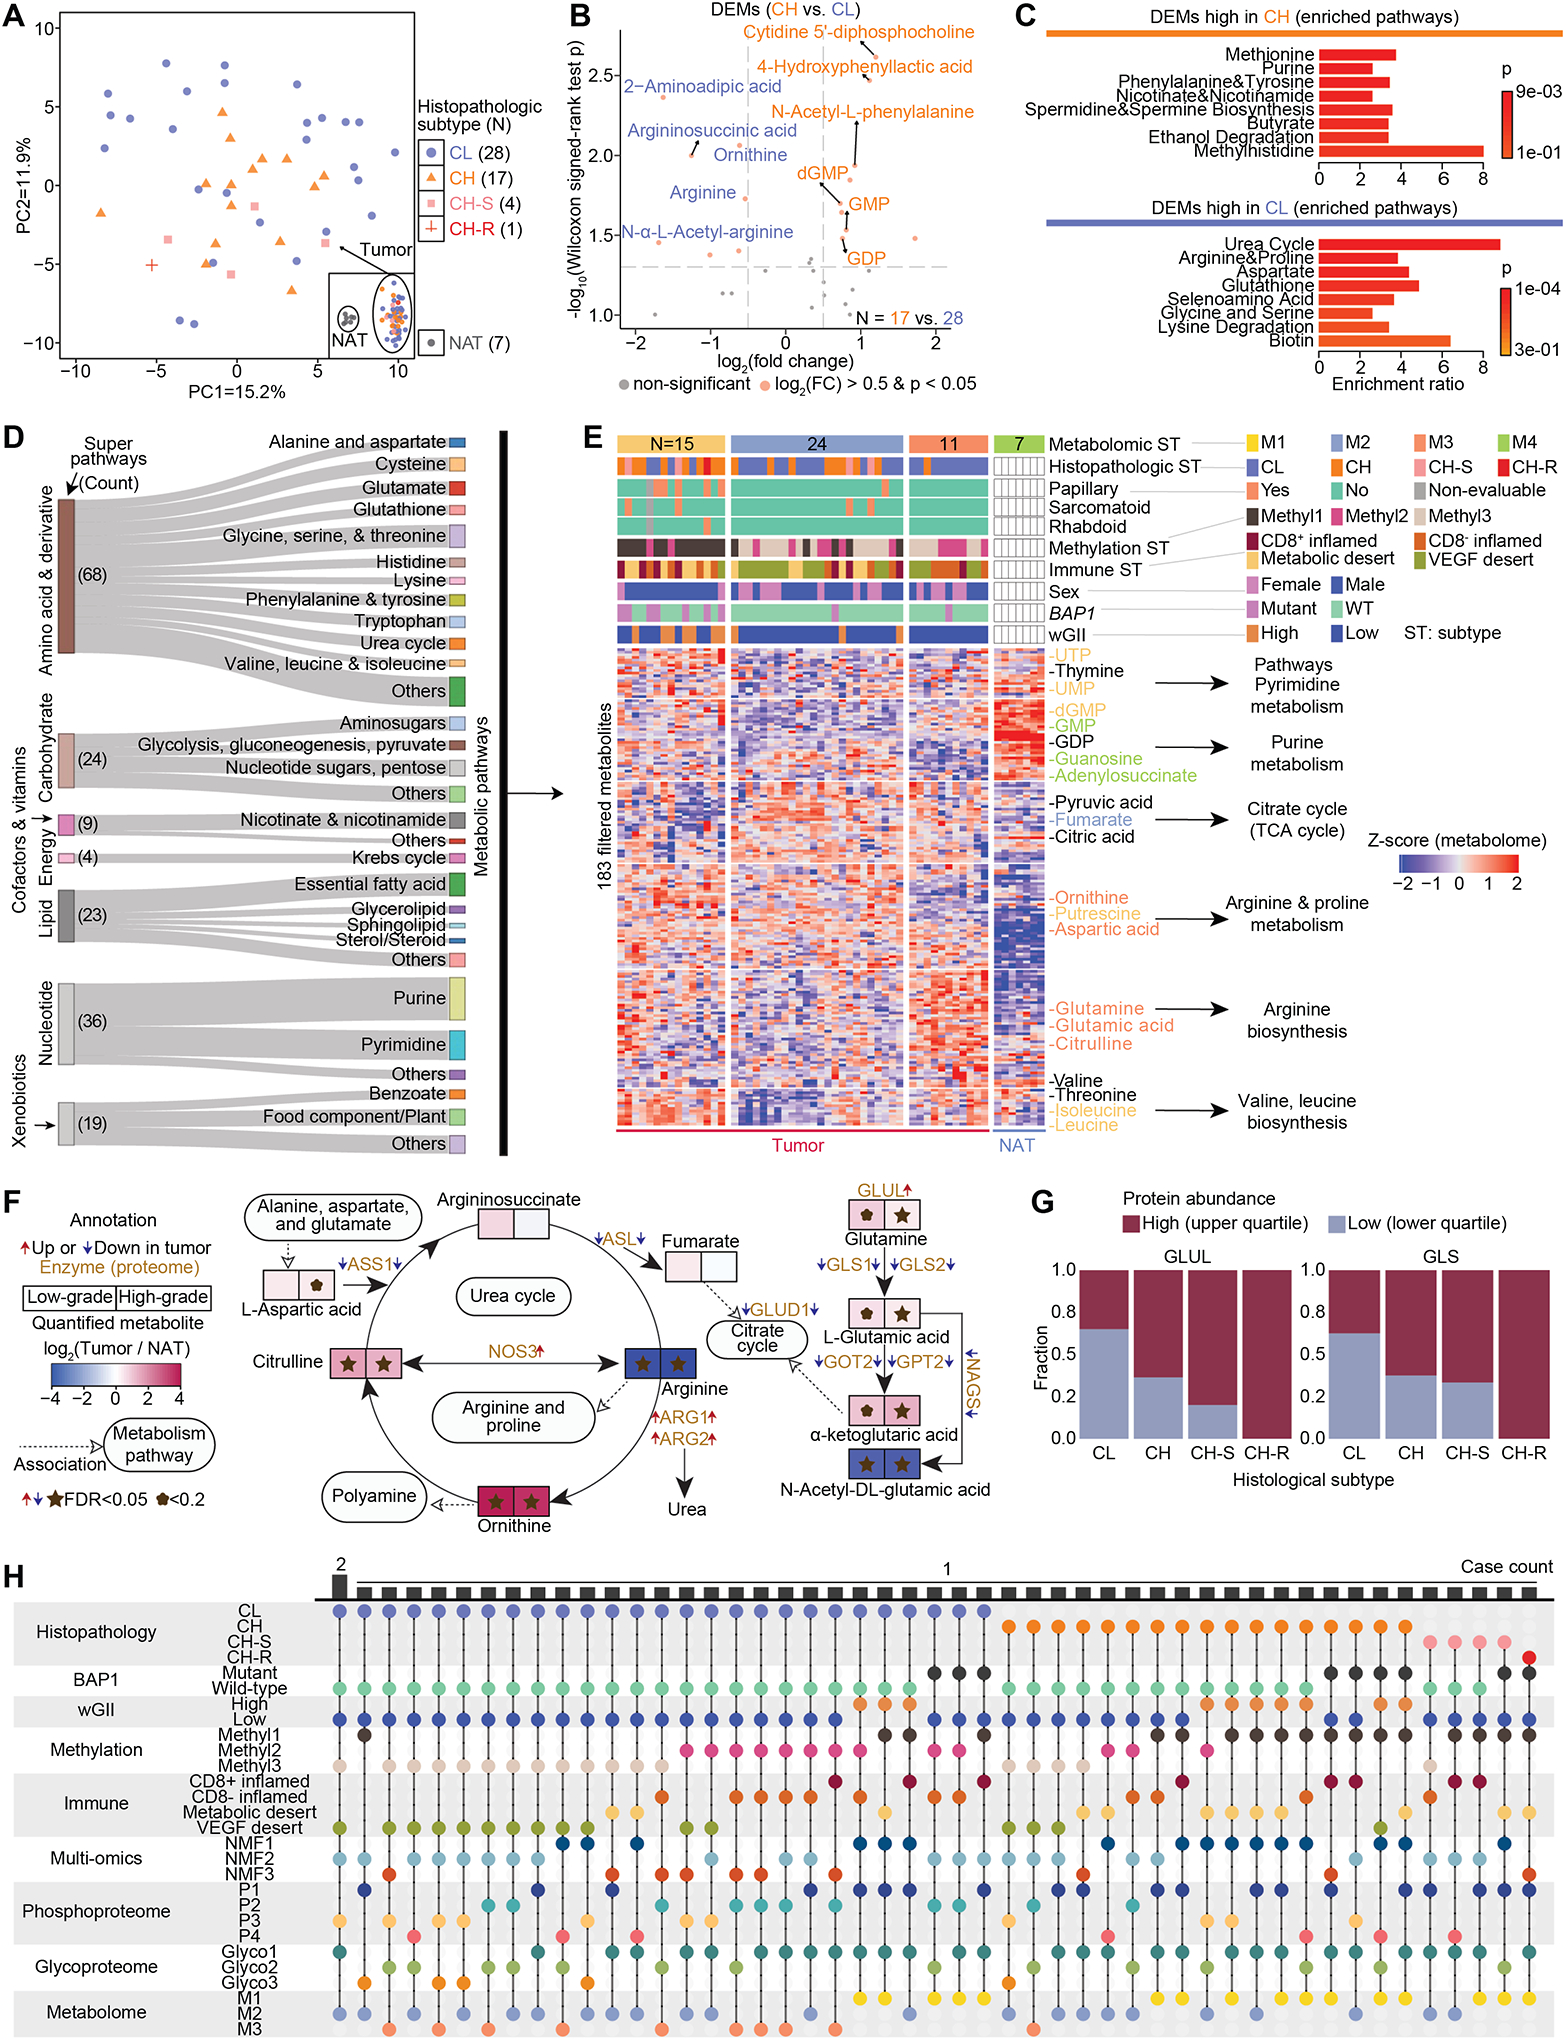
Figure 8. Dysregulated metabolism in high-grade and low-grade ccRCC.

A) PCA plot shows the distribution of 50 tumors by metabolome characterization. The separation with 7 NATs is shown in the inset box.
B) DEMs between high-grade tumors and low-grade tumors. The significantly upregulated DEMs are in orange if their Wilcoxon signed-rank test p < 0.05 and absolute fold change > 2.
C) Enriched metabolic pathways corresponding to CH and CL, respectively. Hypergeometric test p is calculated.
D) Sankey diagram visualizes the distribution of metabolic pathways and super pathways for the 183 metabolites used for metabolomic subtyping.
E) Heatmap shows the four metabolomic subtypes that were identified among the 50 tumors and 7 NATs. The signature metabolites were annotated next to the heatmap and colored by the metabolomic subtype if they are significantly higher in one subtype.
F) Network plot of Arginine biosynthesis, Urea cycle, and Citrate cycle demonstrates the connection of metabolites and enzymes, and the expression fold change of metabolites and direction of enzymes in tumors compared with NATs. Wilcoxon signed-rank test FDR is calculated.
G) Among the 213 cases, the fractions of high expression of GLUL and GLS are higher in high-grade tumors compared with those of low-grade tumors as indicated by these stacked bar plots.
H) The distribution of 50 tumors with multi-level profiling of histological, BAP1 mutation, wGII, methylation, immune, multi-omic, phospho, glyco, and metabolome subtypes.
