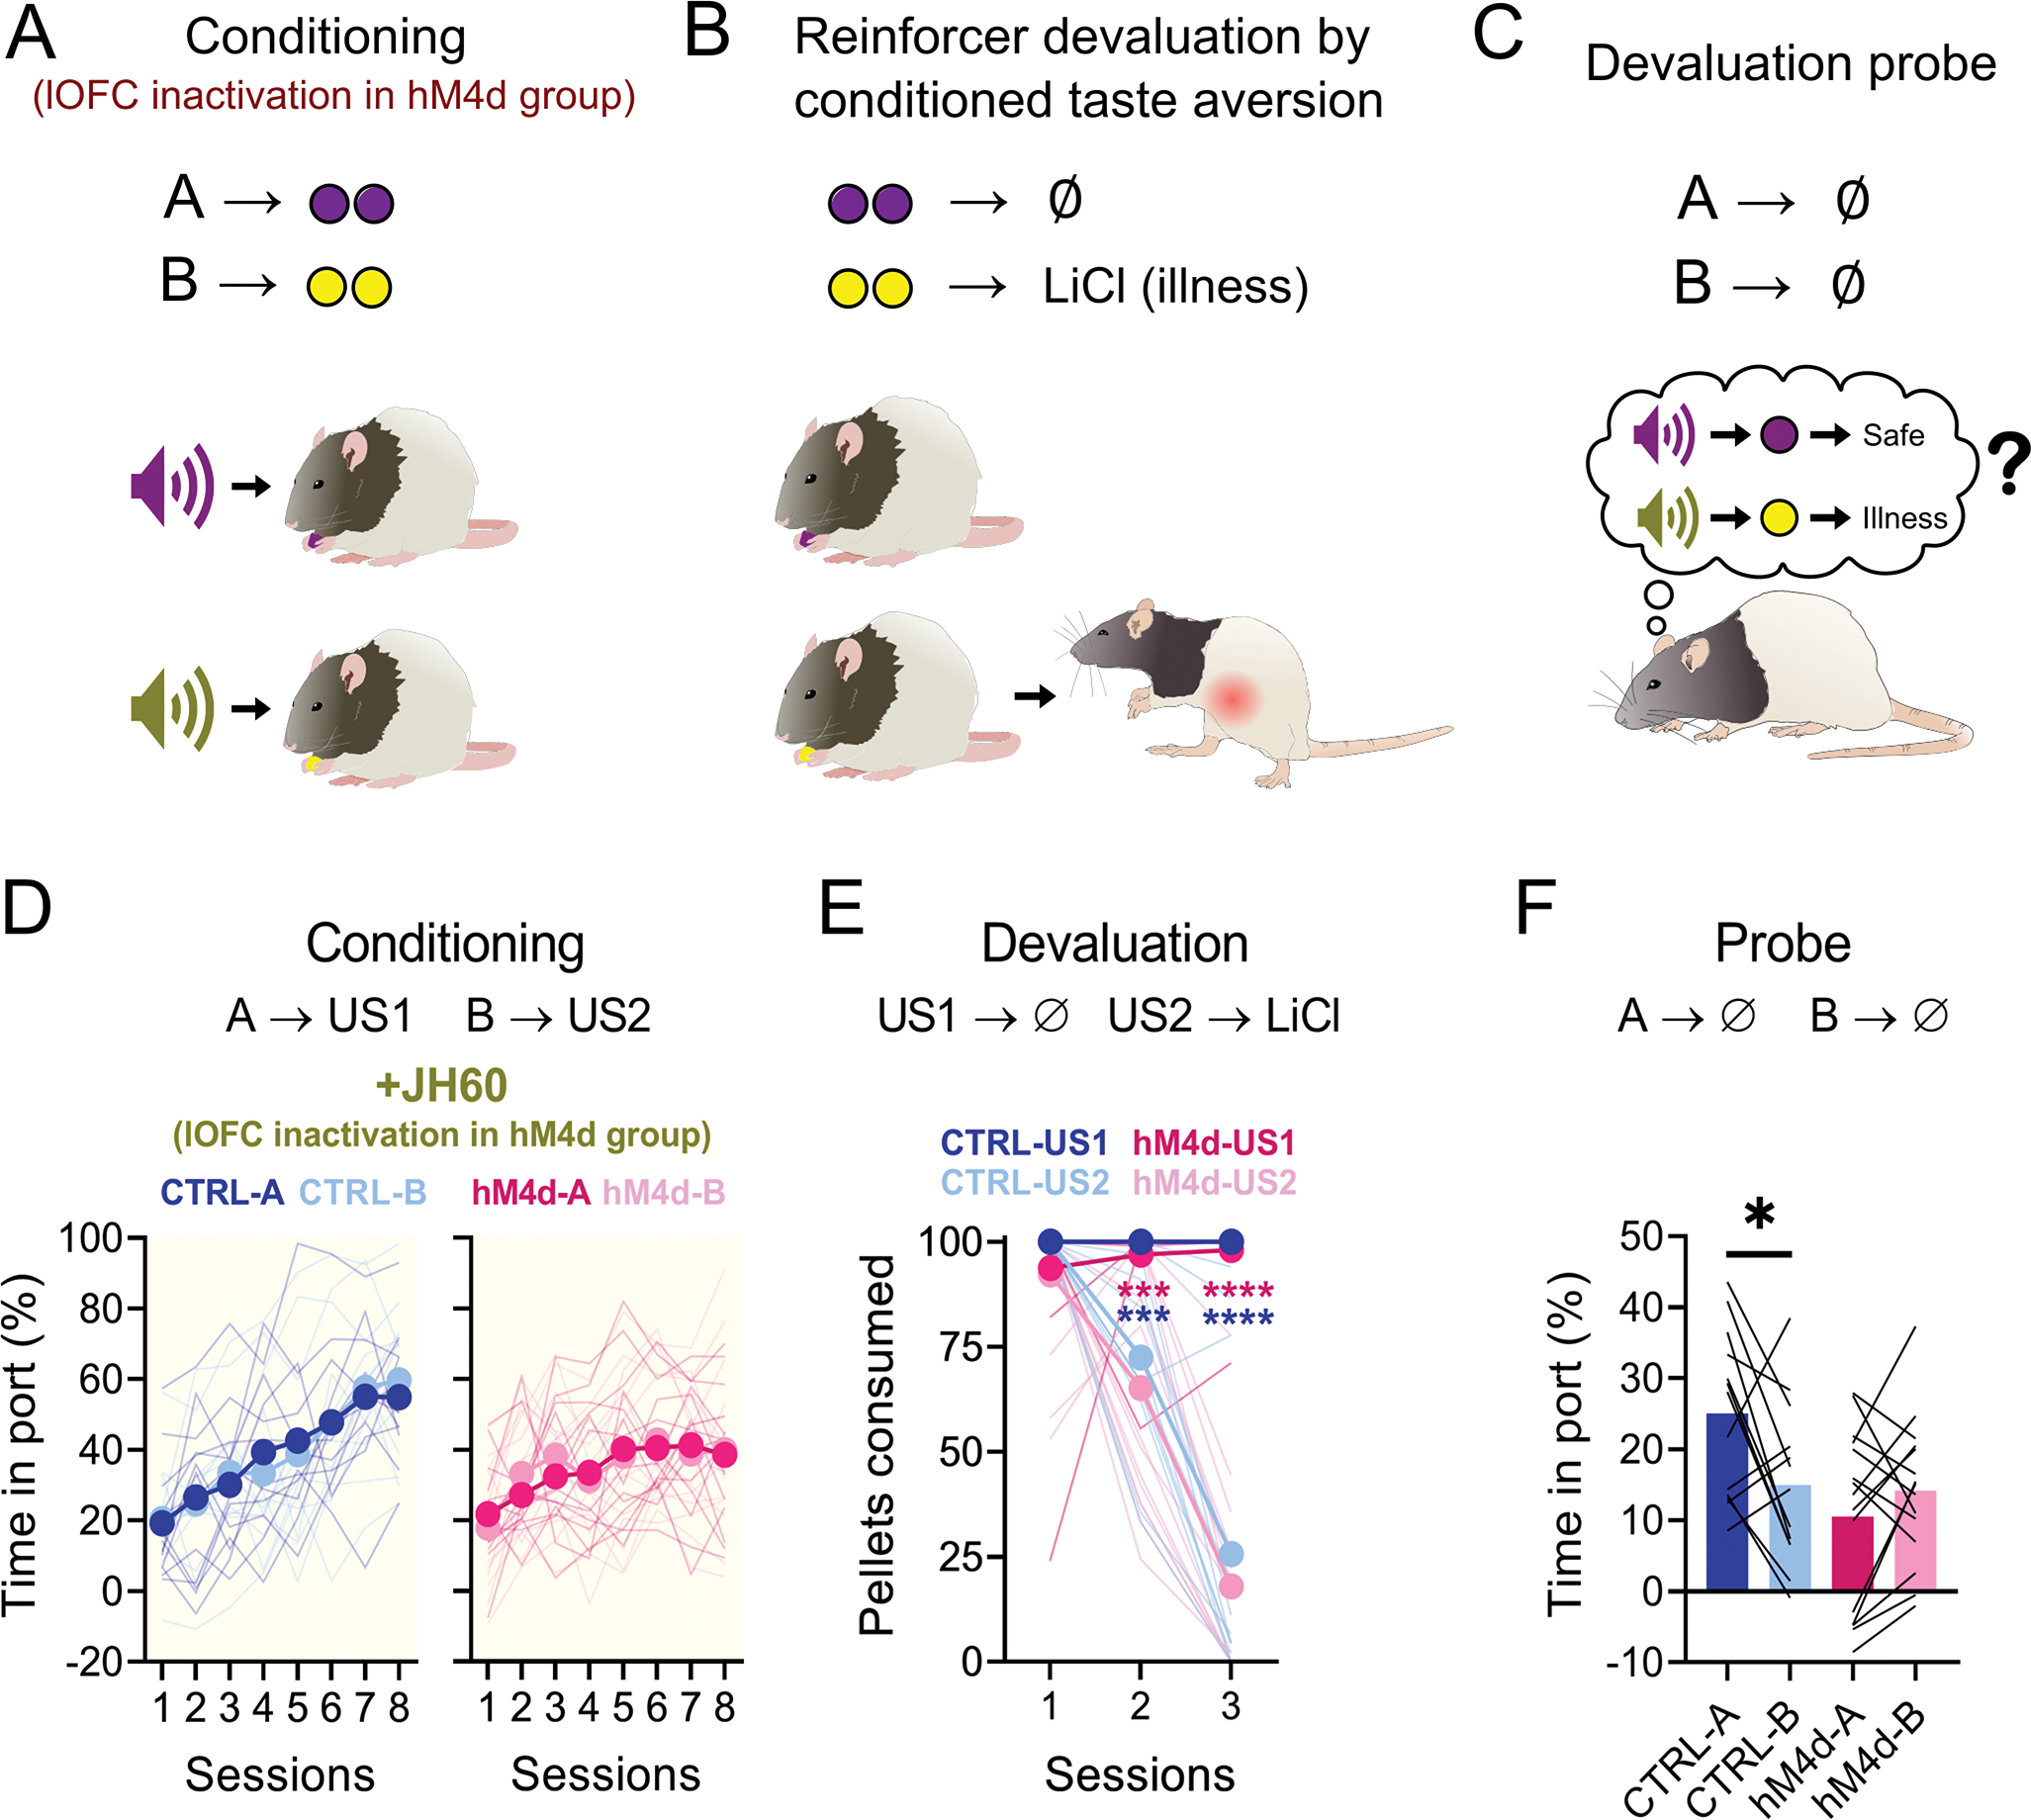
Figure 2. Chemogenetic inactivation of lOFC during conditioning abolishes subsequent sensory-specific responses to devalued cues.

(A-C): Schematic of the behavioral procedures. (A): Rats were conditioned to two cues, A and B, which lead to different rewards. The lOFC was inactivated in the hM4d group. (B): Later, one of the rewards was paired with LiCl injections. (C): Finally, rats were re-exposed to the conditioned cues, testing if a model-based association had been established between them and the rewards. (D): Food cup responding during conditioning. There was no isolated or interaction effect of cue identity (3-way ANOVA; A vs B F(1,26) = 0.021, P = 0.886; sessions vs cue: F(7,182) = 1.353, P = 0.897; sessions vs cue vs group: F(7,182) = 0.066, P = 0.936;), nor an isolated group effect (F(1,26) = 0.717, P = 0.405), and rats of both groups increased responding as sessions progressed (F(7,182) = 26.74, P < 0.0001****). However, there was a significant interaction between group and session progression (F(7,182) = 4.672, P<0.0001****), visible in the last two sessions. (E): Pellet consumption during CTA. Rats from both groups consumed nearly all pellets in the first CTA session and consumed less of the devalued pellet type as sessions progressed (3-way ANOVA; session effect: F(2,52) = 64.18, P<0.0001****; session vs pellet type: F(2,52) = 83.36, P<0.0001****; all other comparisons: F < 3, P > 0.099). (F): Food cup responding during probe. There was a significant effect of group (2-way ANOVA; F(1,26) = 4.34, P=0.047*), and the interaction of the group with the cues (F(1,26) = 8.013, P=0.009**), as control rats responded more to A than to B, while hM4d rats responded equally to both cues (all other comparisons: F < 3.5, P > 0.089). Asterisks in graphs indicate post-hoc multiple comparison test results. See Supplementary Table 1 for more detailed statistics. Data are represented as mean ± SEM. CTRL n= 13 and hM4d n=15 biologically independent animals. *P<0.05; ***P<0.001; ****P<0.0001.
