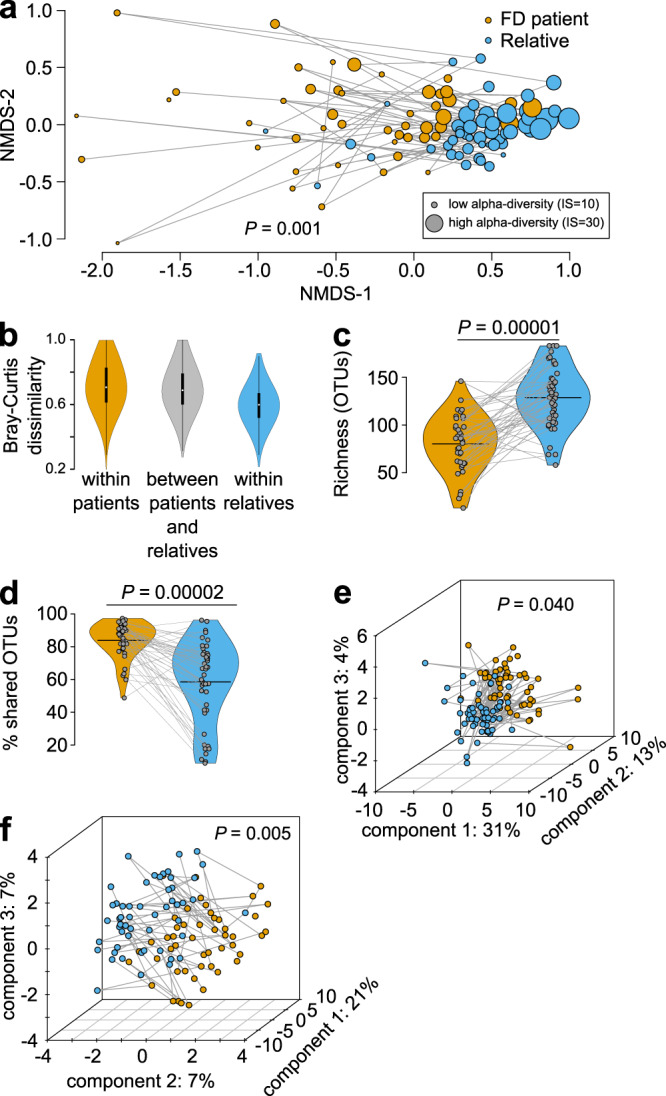
Fig. 1. FD alters the microbiome and metabolome.

a Non-metric multidimensional scaling (NMDS) of 16 S rRNA-based stool microbiome diversity in FD patients and healthy relatives (all patient-relative pairs connected with lines). IS, inverse-Simpson’s index. b, Microbiome beta-diversity (Bray-Curtis dissimilarity) within and between FD patients and paired relatives (each violin plot contains a box and whisker plot here a white dot = median, box = interquartile range (IQR), whiskers = 1.5 times IQR). c, d, Microbiome richness (c) and percentage (%) of shared operational taxonomic units (OTUs) (d) between FD patient and healthy relatives (colors as in a; bars = mean; lines connect patients and relatives). e, f Partial least-squares discriminant analysis (PLSDA) of 1H-NMR-based stool (e) and serum (f) metabolome diversity in FD patients and healthy relatives (colors as in a, b). n = a, b, 48 patients, 51 relatives; c, d, 38 patients, 47 relatives, 47 pairs; e, 54 patient, 58 relatives; f, 49 patients, 53 relatives. PERMANOVA of Bray-Curtis dissimilarity (a, F = 6.847, df = 1, R2 = 0.066) or Euclidean distance (e, F = 2.153, df = 1, R2 = 0.0191; f, F = 2.506, df = 1, R2 = 0.0245); permutational paired t-testing, two-sided (c, mean t-statistic = −5.423, df = 29, mean difference between group means = −45.114, mean 95% confidence interval of the difference between the group means = −62.130 to −28.100; d, mean t-statistic = 5.220, df = 29, mean difference between group means = 24.944, mean 95% confidence interval of the difference between the group means = 15.16 to 34.73).
