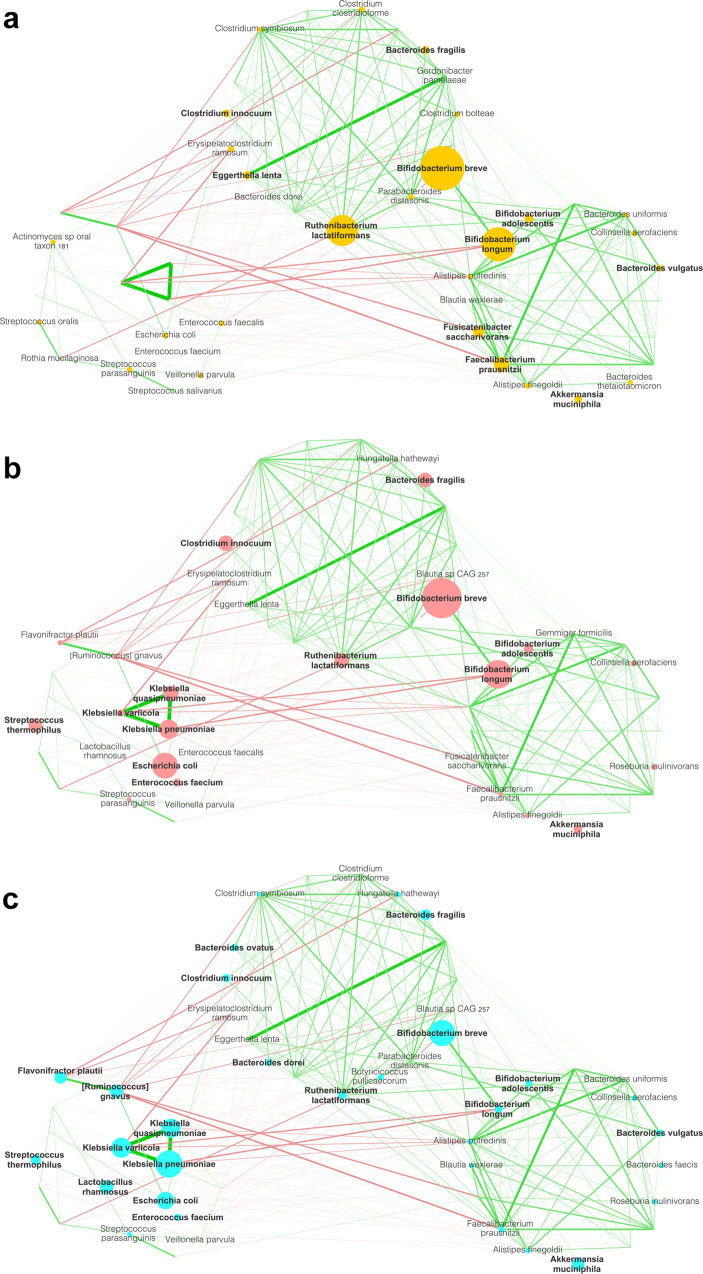
Fig. 1. A different gut microbiome network structure is found in pediatric HSCT patients in association with EN, PN, and LVX prophylaxis.
Gut microbiome networks are shown for each treatment group (EN in yellow, (a); PN LVX (–) in pink, (b); PN LVX (+) in cyan, (c); n = 30 for each group), including all timepoints (i.e., before (T0) and after HSCT (T1 and T2)). Node sizes are proportional to the mean relative abundance of the species, and the network layout, derived from spin-glass clustering into modules, is maintained over the three plots. Green edges represent positive correlations, while red edges are indicative of negative correlations. Only edges with Spearman’s correlation FDR-corrected p < 0.05 and (rho) ρ < −0.3 or ρ > 0.3 are shown. Edge line width is proportional to Spearman’s ρ. To simplify the reading of the networks, only the nodes with an abundance >0.2% were labeled; bold labels correspond to species with an abundance higher than 1%. To construct the graph, only species with relative abundance >0.3% in at least 5% of the samples were considered.

