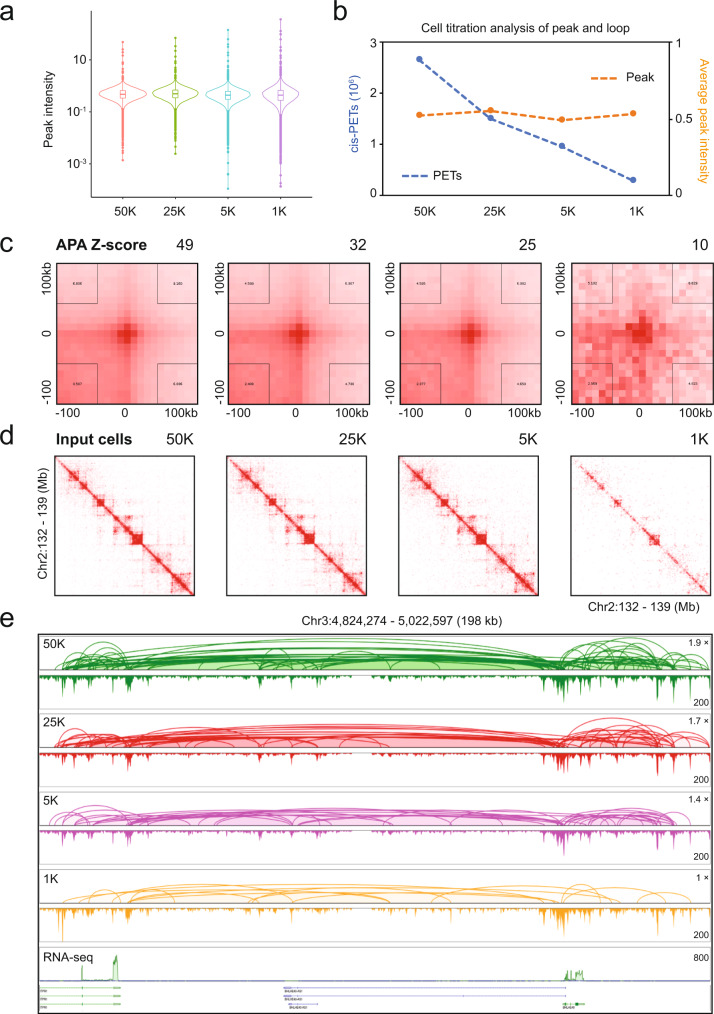
Fig. 3. Titration of input cells for ChIATAC analysis.
a Violin plot of normalized peak intensity (peaks called by using 50 K ChIATAC data, n = 71,504) across data produced from 50,000 down to 1000 cells. In the box plot, middle line denotes median; box denotes interquartile range (IQR); and whiskers denote 1.5× IQR. b Line plot showing the overview of the number of non-redundant intra-chromosomal PETs (cis-PETs > 8 kb) per hundred million raw reads and normalized average peak intensity (n = 71,504) across data produced from 50,000 down to 1000 cells. c APA of chromatin loops in ChIATAC data produced by 50,000 cells, and the corresponding loop signals in 2D contact matrices of ChIATAC data produced from 25,000 down to 1000 cells. Z-score measures the enrichment of the aggregated signal on the 2D contact matrices. d Example views of 2D contact matrices from ChIATAC data produced from 50,000 down to 1000 cells. e Example views of genome browser tracks of ChIATAC data produced from 50,000 (50 K), 25,000 (25 K), 5000 (5 K), down to 1000 (1 K) input cells, and RNA-seq. The normalized fold change of loop PET count is provided. The relative looping frequency (PET counts) is 1.9-fold for 50 K, 1.7-fold for 25 K, 1.4-fold for 5 K, and 1-fold for 1 K input cells. The signal intensity scales (y-axis) of peaks (maximum of reads pileup) for each track are provided. Source data are provided as a Source Data file.

