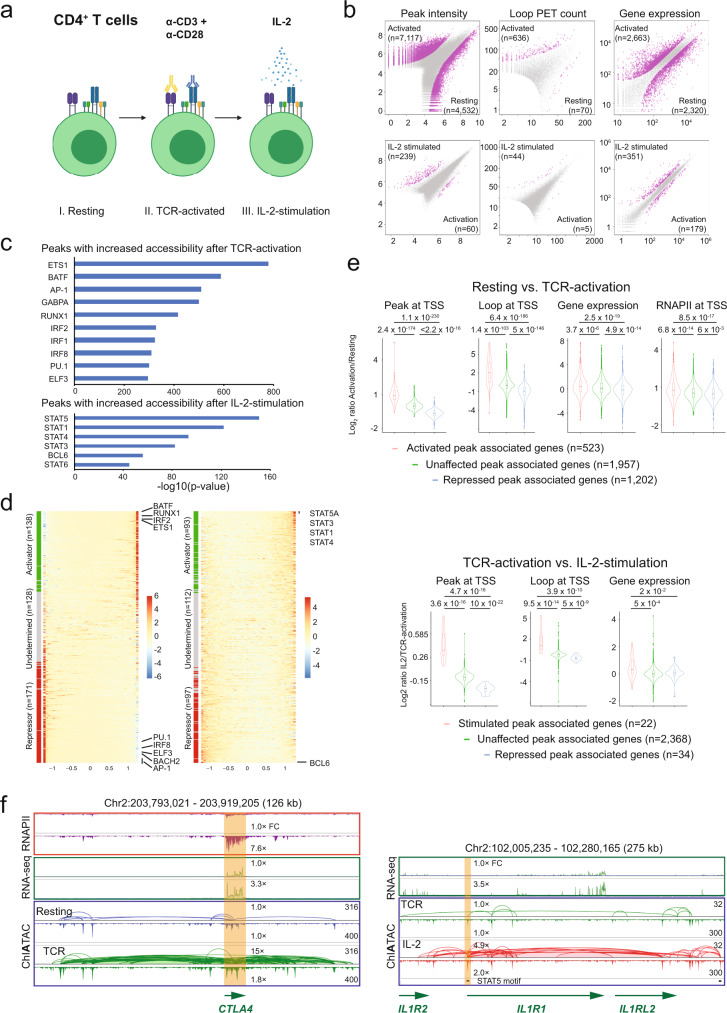
Fig. 4. Characterization of human 3D epigenome of T cells in activations.
a Human CD4+ T cells used in ChIATAC experiments: I. Freshly isolated CD4+ T cells (resting), II. Cells activated with anti-CD3 + anti-CD28 (TCR-activation). And III. Cells further stimulated with IL-2. b Scatter plots showing differential peak intensity (left), chromatin loop PET count (middle), and gene expression (right) between resting vs. TCR-activation (top) and TCR-activation vs. IL-2-stimulation (bottom). The features (peaks, loops, and gene expression) with significant changes are shown as magenta dots, and the numbers of data points are in parenthesis. c HOMER motif enrichment analysis from genomic regions with increased chromatin accessibility after TCR-activation (top) and IL-2-stimulation (bottom). d Heatmap showing the distribution of the correlations between RNA expression and predicted DNA binding site signal for each TF. TFs are sorted from strongest predicted activator to repressor (from top to bottom). Left, Resting vs. TCR-activation; Right, TCR-activation vs. IL-2-stimulation. e Violin plots of chromatin accessibility, looping, gene expression, RNAPII binding at the TSS of genes associated with ChIATAC peaks showing differential chromatin accessibilities after TCR-activation (top) or IL-2-stimulation (bottom). The p-values were calculated by the one-sided Wilcoxson rank sum test. In the box plot, middle line denotes median; box denotes interquartile range (IQR); and whiskers denote 1.5× IQR. f Example views of genome browser tracks of ChIATAC, RNAPII ChIA-PET, and RNA-seq of CD4+ T cells at resting and TCR-activation states (left) or at TCR-activation and IL-2-stimulation states (right). Highlighted are the regions showing increased chromatin accessibility and RNAPII binding after TCR-activation (left) or IL-2-stimulation (right). Relative fold change (FC) of RNAPII binding, RNA-seq, and ChIATAC for looping and chromatin accessibility in reference to the Resting cell data (1.0× FC) are provided. Source data are provided as a Source Data file.

