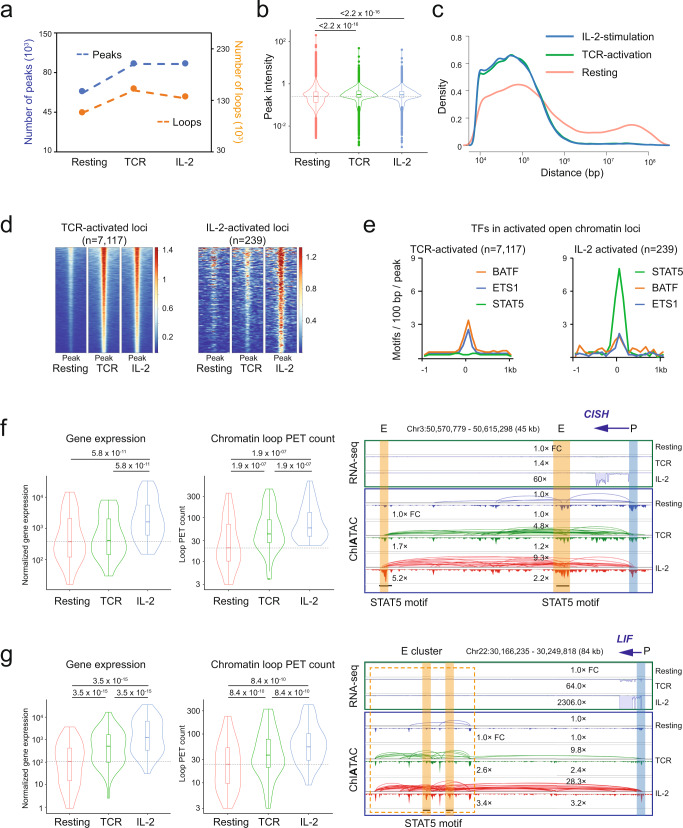
Fig. 5. Dynamic changes of T cell 3D epigenome during activations.
a The numbers of peaks and loops in ChIATAC data of the resting, TCR-activated, and IL-2-stimulated CD4+ T cells. b Normalized peak intensity of ChIATAC peaks (n = 110,466) from three states of CD4+ T cells. The p-value of significance was calculated by Wilcoxon rank test (one-sided, paired). In the box plot, middle line denotes median; box denotes interquartile range (IQR); and whiskers denote 1.5× IQR. c Profiling of intra-chromosomal loop spans in ChIATAC data from three states of CD4+ T cells. d Heatmaps of peak intensity (±1 kb). Left, TCR-activated open chromatin loci (n = 7117) and the corresponding signals in resting and IL-2-stimulated cells. Right, IL-2-stimulated open chromatin loci (n = 239) with the signals in resting and TCR-activated cells as references. e Aggregation plots for the distribution of TF motifs at open chromatin loci. f Group 1 genes (n = 34) with moderate change of gene expression after TCR-activation but induced significantly by IL-2-stimulation. Left, violin plots of gene expression and associated loop PET count in three states of CD4+ T cells. The dotted lines show the medians in Resting CD4+ T cells. The significance was calculated by Wilcoxson signed rank test (one-sided, paired). In all box plots, middle line denotes median; box denotes interquartile range (IQR); and whiskers denote 1.5× IQR. Right, example browser view of RNA-seq and ChIATAC data at enhancer with STAT5 binding motif (highlighted in orange) and gene promoter (highlighted in blue). Relative fold changes (FC) of RNA-seq, loop PET count, and chromatin accessibility in reference to the Resting cell data (1.0× FC) are provided. g Group 2 genes (n = 48) with significantly induced gene expression and corresponding loop changes by TCR-activation and IL-2-stimulation. Left, same as in f, violin plots of gene expression and chromatin loop PET count associated with gene TSSs at 3 states of CD4+ T cells. Right, example browser view of RNA-seq and ChIATAC data at enhancer cluster (dotted box) with STAT5 binding motif highlighted in orange and gene promoter highlighted in blue. Same as in f, relative fold changes (FC) are provided. Source data are provided as a Source Data file.

