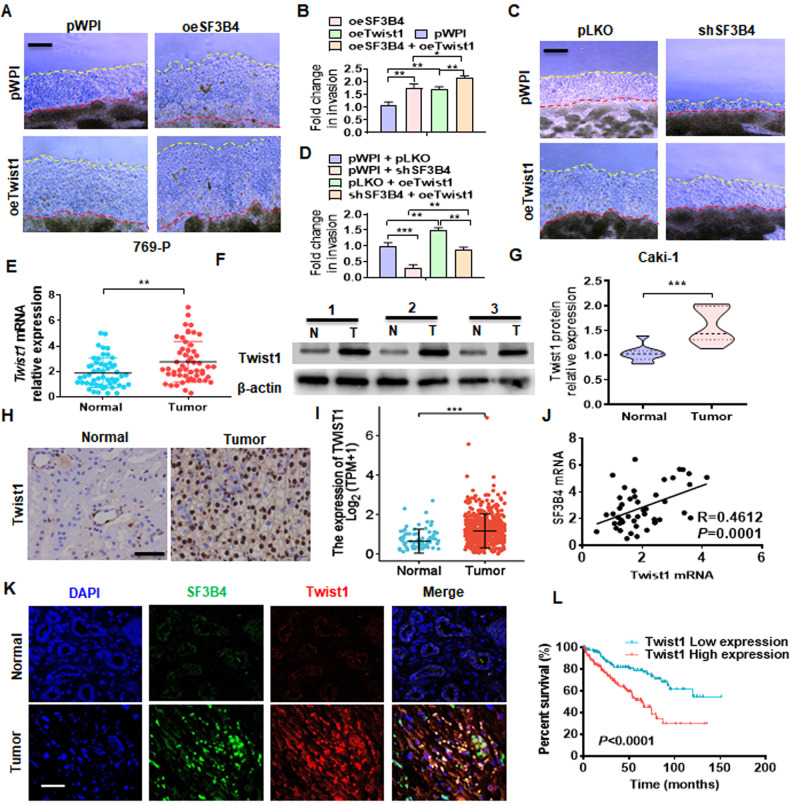
Fig. 4. Upregulation of Twist1 contributes to the progression of ccRCC.
A 769-P cells were transfected with oeSF3B4 or oeTwist1, alone or together, and then a 3D Matrigel drop invasion assay detected the invasion of cells. Scale bar = 100 μm. B Quantitative analysis of A. C Caki-1 cells were transfected with shSF3B4 or oeTwist1, alone or together, and then a 3D Matrigel drop invasion assay detected the invasion of cells. D Quantitative analysis of C. E RT-qPCR detected the Twist1 mRNA expression in normal (n = 53) and ccRCC (n = 53) tissues. F, G Twist1 protein level in normal or ccRCC tissues was measured by western blot. H Immunohistochemical staining detected the Twist1 in clinical samples. Scale bar = 50 μm. I Twist1 mRNA level was analyzed from the TCGA database in normal (N, n = 72) and ccRCC (T, n = 533) tissues. J The correlation between SF3B4 and Twist1 mRNA in ccRCC tissues was analyzed by Pearson correlation analysis of our clinical data (R = 0.4612, P = 0.0001). K Immunofluorescence staining detected the expression of SF3B4 and Twist1 in ccRCC and normal renal tissue. Scale bar = 100 μm. L According to the TCGA database with low and high Twist1 levels, the overall survival of ccRCC patients was analyzed using the Kaplan–Meier method. All data are expressed as the mean ± SEM of three independent experiments. **P < 0.01, ***P < 0.001 vs. their corresponding controls.

