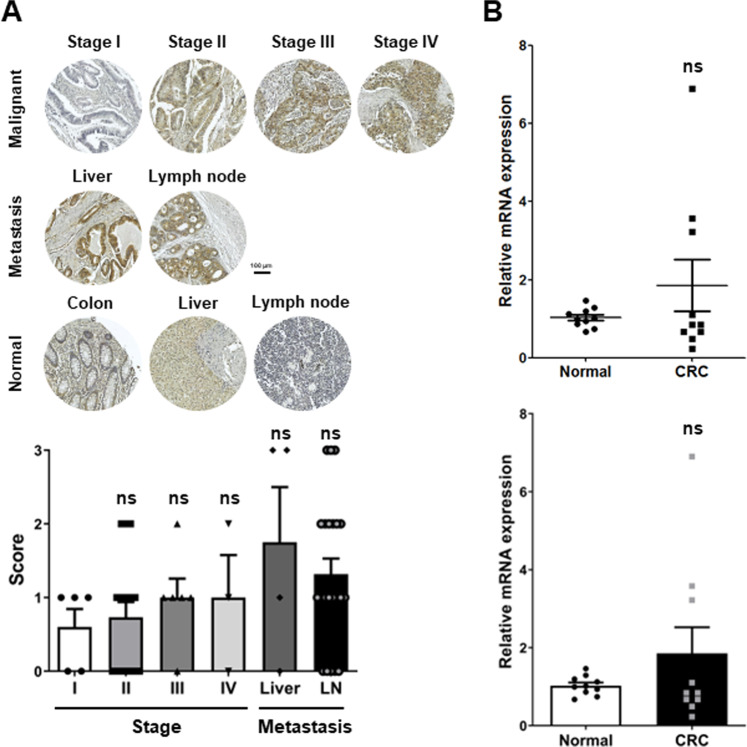
Fig. 5. Validation of the possibility of NCKAP1 as a cancer diagnostic marker.
A IHC was performed with anti-NCKAP1 from TMA. Bar, 100 μm. Quantitative results on the right: the graph represents the score of NCKAP1. Data are reported as the mean ± SEM. One-way ANOVA and Bonferroni’s post hoc test. ns p > 0.05 vs. Stage I. (Stage I: n = 5, II: n = 16, III: n = 6, IV:3, Liver: n = 4, LN: n = 22). B The mRNA expression of NCKAP1 was confirmed by qRT-PCR analysis in blood buffy coats from patients with colon cancer. The bar graph below the dot graph represents the mean. Data are reported as the mean ± SEM. Student’s t-test. ns: non-significant (n = 10).

