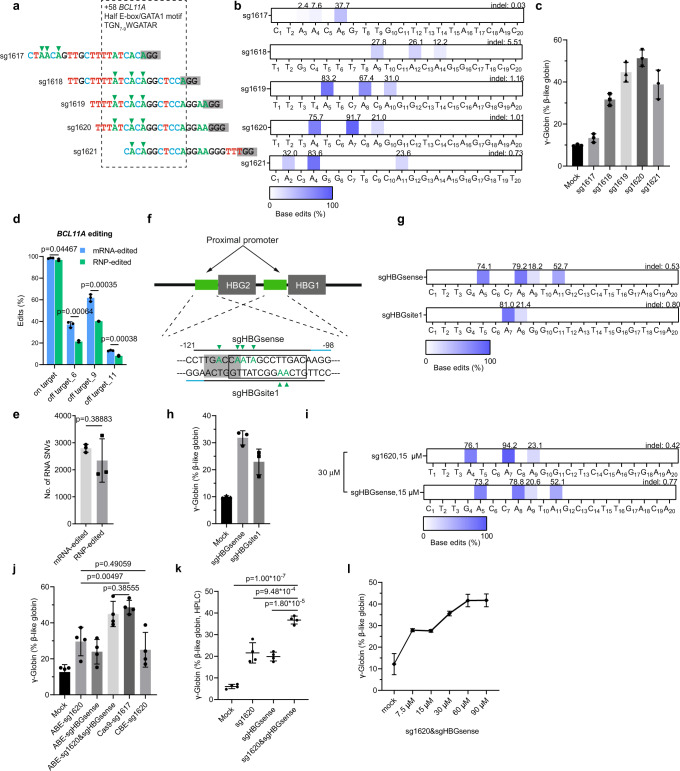
Fig. 1. Efficient adenine base editing at the +58 BCL11A erythroid enhancer and HBG promoters in human CD34+ HSPCs.
a Five sgRNAs targeting the core TGN7-9WGATAR half E-box/GATA1 binding motif (shown in box) at +58 BCL11A erythroid enhancer with predominant base editing position indicated by arrowhead and PAM shaded. b Base editing by ABE8e complexed with each of five sgRNAs in human CD34+ HSPCs. Heat map displays base edit frequency. c, h Percentage of γ-gene expression by RT-qPCR analysis after in vitro erythroid maturation of HSPCs edited by each of (or combined) the indicated sgRNAs complexed with ABE8e. Data are plotted as mean ± sd. n = 3 independent experiments. d Frequency of on-target and three validated sg1620-dependent DNA off-target sites with ABE8e mRNA and RNP delivery. Data were presented as mean ± sd, n = 3 independent experiments. e RNA off-target for mRNA and RNP groups. Data were presented as mean ± sd and analyzed with the unpaired two-tailed Student’s t test. p values have been noted on the corresponding comparisons. n = 3 independent experiments. f Sequences of two sgRNAs targeting promoters of the HBG. BCL11A-binding sites are shaded. The −114/−102 13 bp HPFH deletion is indicated by an empty box. Predominant base editing positions were indicated by green arrowheads. g Editing efficiency by ABE8e complexed with sgHBGsense or sgHBGsite1. i Multiplex base editing by ABE8e-sg1620&sgHBGsense. j Percentage of γ-gene expression determined by RT-qPCR in HSPCs edited by ABE8e-sg1620 or/and sgHBGsense, A3A (N57Q)-BE3-sg1620 and 3 × NLS-SpCas9-sg1617 targeting +58 BCL11A enhancer. Data were presented as mean ± sd. n = 4 independent experiments. k Percentage of γ-globin determined by RP-HPLC analysis after in vitro erythroid maturation of HSPCs edited by the sg1620, sgHBGsense, and sg1620&sgHBGsense complexed with ABE8e. Data are plotted as mean ± sd. n = 4 independent experiments. l γ-globin gene expression by RT-qPCR analysis of erythroid progeny after dose response of RNP electroporation of HSPCs. Data were presented as mean ± sd, n = 3 independent experiments. All statistical significance in the figures were analyzed with the unpaired two-tailed Student’s t test, with p values noted where appropriate.

