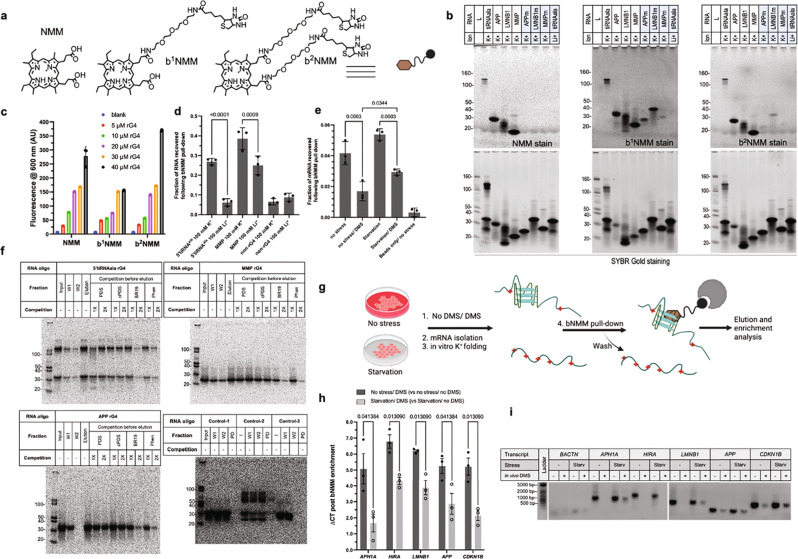
Fig. 3. Biotin-functionalized NMM (bNMM) as a selective probe to pull down RNA G-quadruplexes.
a Chemical structure of NMM, a parallel G4 specific porphyrin (right) and biotin functionalized NMMs (synthesis and characterization in SI). b gel staining demonstrates double biotinylated NMM shows similar rG4 staining behavior as its parent compound while the single biotinylated version is less selective, ladder represents RNA size marker with molecular weight in Dalton. c Biotin functionalized NMMs show similar G4 affinity as their parent compound in NMM fluorescence assay, 5' tiRNAala G4 is used for the selectivity test since 5' tiRNAala-NMM interaction characterization has been already established, data are presented as mean values + /- SD, n = 3. d Validation of bNMM-based rG4 pull-down approach using synthetic rG4 and control oligos, data are presented as mean values + /− SD, n = 3, ordinary One-way ANOVA, pairwise comparison, and adjusted p-values are provided. e Validation of bNMM-rG4 pull-down approach using cellular mRNA. This also affirms that more Gs are protected from DMS reactivity under starvation stress, data are presented as mean values + /− SD, n = 3, ordinary One-way ANOVA, pairwise comparisons, and adjusted p-values are provided. f Competition of G4 bound bNMM with several G4 interacting small molecules. BRACO19 and PhenDC3 were able to compete off bNMM from the bNMM-rG4 complex in dose-dependent manner (1X = 2.5 µM, 2X = 5 µM). On the other hand, PDS and cPDS were unable to compete off bNMM under the test conditions (W1- wash 1, W2- wash 2, BR19- BRACO-19, Phen- PhenDC3), ladder represents RNA size marker with molecular weight in Dalton. g Schematic of cellular rG4 enrichment and their quantification. Cellular mRNA (with or without the starvation stress and with (+) and without (-) the DMS reaction) was isolated and folded in presence of K+ before mixing with bNMM beads. The captured mRNA pool was eluted, and reverse transcribed, and the enrichment was quantified using qPCR and PCR. h Candidate mRNAs from DMSeq experiments show a higher abundance in the mRNA isolated from DMS-treated stressed cells, clearly indicating their folding into rG4s in vivo. A smaller difference in ΔCT values under starvation condition indicated rG4 enrichment under such conditions. Data are presented as mean values + /− SD, n = 3, Multiple unpaired t-tests, and q values are provided. i RT-PCR amplicons were run in the agarose gel electrophoresis to visualize the difference in the bNMM bound mRNA under similar conditions as in h, ladder represents DNA base pair molecular marker with weight in Dalton, source image Supplementary Fig. 7.

