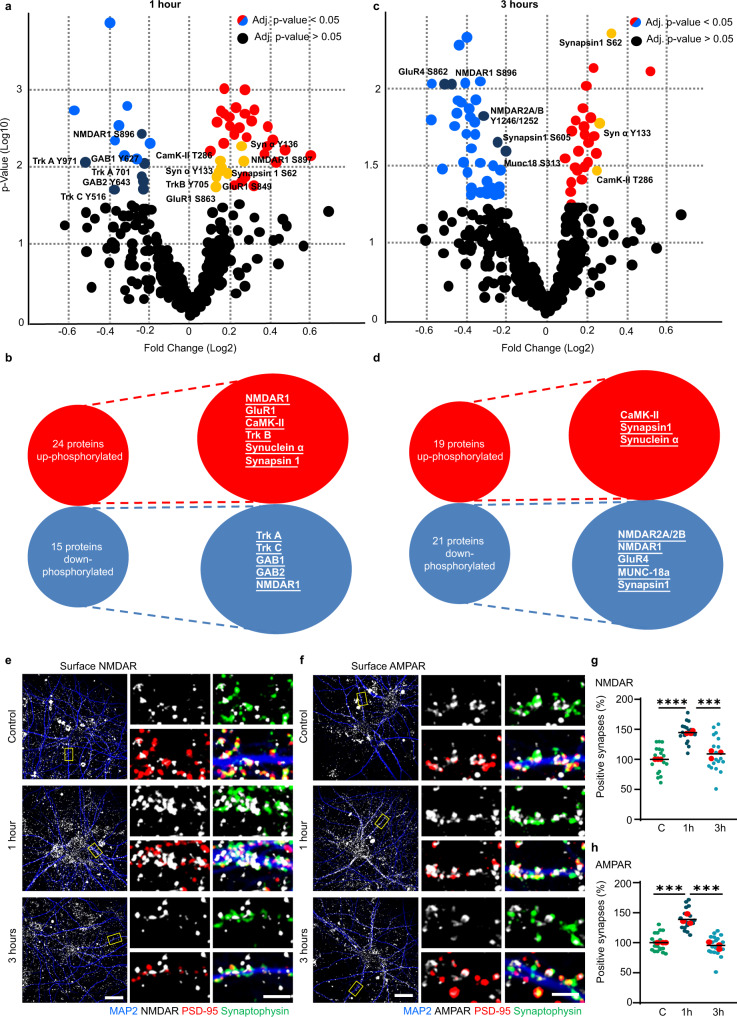
Fig. 3. IL-13 causes the large-scale phosphorylation of glutamate receptors and presynaptic proteins.
a, b Volcanoplot and list of proteins showing significant change in their phosphorylation (up or down) 1 h after neurons were exposed to IL-13 (50 ng/ml) or control (0.1% BSA). red = up-phosphorylated, blue = down-phosphorylated. N = 4. c, d Volcanoplot and list of proteins showing significant change in their phosphorylation (up or down) 3 h after neurons were exposed to IL-13 (50 ng/ml) or control (0.1% BSA). red = up-phosphorylated, blue = down-phosphorylated. N = 4. Complete list of significantly phosphorylated proteins can be found in supplementary information. e–g Extracellular NDMAR antibody feeding assay co-stained with MAP2, Synaptophysin and PSD-95 in rat primary cortical neurons 1 h and 3 h after IL-13 treatment (50 ng/ml) or vehicle (0.1% BSA). Significant increase in surface NMDAR is visible 1 h (p < 0.0001) after IL-13 application. N = 3. Scale bar overview: 20 μm, scale bar insert: 2 μm. ***: p < 0.001; ****: p < 0.0001. f–h Extracellular AMPAR antibody feeding assay co-stained with MAP2, Synaptophysin and PSD-95 in rat primary cortical neurons 1 h and 3 h after IL-13 treatment (50 ng/ml) vs vehicle (0.1% BSA). Significant increase in surface AMPAR is visible 1 h (p = 0.0005) after IL-13 application. N = 3. Scale bar overview: 20 μm, scale bar insert: 2 μm. ***: p < 0.001 (a, c): PROTein array Expression AnalysiS; https://github.com/Rida-Rehman/PROTEAS. (f, g): One-way ANOVA with Sidak’s multiple comparison. Source data are provided as a Source Data file.

