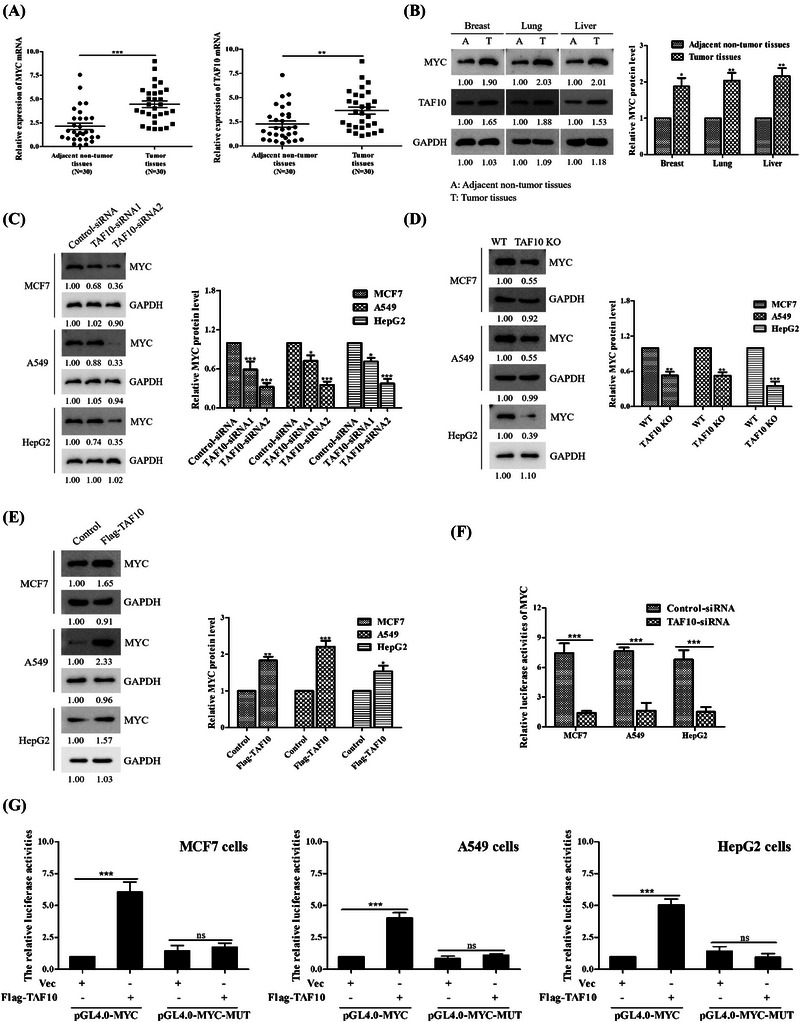
FIGURE 1.

TAF10 enhances MYC transcriptional activity. (A) Real‐time quantitative PCR was used to determine the expression level of TAF10 and MYC in breast, lung, liver cancer tissues and corresponding adjacent non‐tumour tissues in 30 patients. (B) Tumour and adjacent non‐tumour tissues were obtained for primary culture. The levels of MYC and TAF10 proteins were evaluated using Western blotting. (C) Immunoblotting demonstrates the specific knockdown effect of TAF10 siRNA on endogenous MYC protein. TAF10 siRNA and Control siRNA plasmids were transfected into MCF7, A549 and HepG2 cells, respectively. Anti‐MYC or GAPDH antibody was used to probe whole‐cell extracts that were prepared 24 h after transfection. (D) Quantification of MYC expression by Western blot in TAF10 KO cells. Level of relative MYC expression after TAF10 knockout in MCF7, A549 and HepG2 cells. (E) Overexpression of TAF10 determined the MYC protein concentration. MCF7 cells were transfected with Flag‐labelled TAF10, and the endogenous MYC protein level was determined by Western blotting. (F) Luciferase reporter assays in control and TAF10 knockdown cells. MCF7, A549 and HepG2 cells were respectively transfected with Control siRNA or TAF10 siRNA. The MYC promoter activity was analysed using the dual luciferase reporter assay 24 h later. (G) TAF10 is capable of activating MYC‐responsive promoters. MCF7, A549 and HepG2 cells were transfected for 24 h with an empty vector (Vec) or Flag‐labelled TAF10 (Flag‐TAF10). The dual luciferase reporter assay was used to evaluate the activity of the MYC promoter. The t‐test was applied to the data in column A. Using a two‐way ANOVA, F's data were analysed. The data displayed in G were analysed using a one‐way ANOVA. The blots represented three independent experiments. All data are presented as the mean ± SEM of n = 3. ***p < .001, **p < .01, ns, no significance
