FIGURE 2.

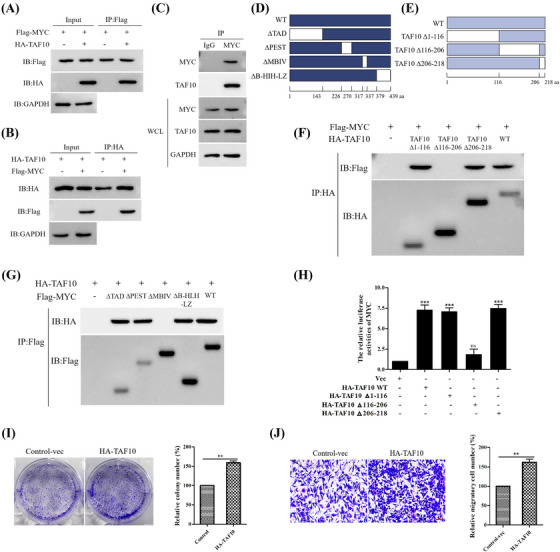
TAF10 promotes cancer cell proliferation and migration. (A and B) MCF7 cells were transfected with Flag‐labelled MYC and HA‐labelled TAF10, and the interaction between MYC and TAF10 was detected by Co‐IP. (C) Endogenous interaction of MYC and TAF10 was tested in MCF7 cells. (D) Schematic representation of MYC mutants. (E) Schematic representation of TAF10 mutants. Co‐IP was used to detect the interaction between the TAF10 mutants and MYC in MCF7 cells. Co‐IP was used to detect the interaction. (G) Interaction between the MYC mutants and TAF10 in MCF7 cells was detected using Co‐IP. (H) MCF7 cells were co‐transfected with empty vector (Vec) and HA‐labelled TAF10 wild‐type (HA‐TAF10 WT) or mutants (HA‐TAF10 Δ1‐116, HA‐TAF10 Δ116‐206, HA‐TAF10 Δ206‐218). The MYC promoter activity was analysed using the dual luciferase reporter assay 24 h later. (I) Overexpression of TAF10 assessed the capacity for colony formation. MCF7 cells were transfected with either Control‐vec or HA‐TAF10. The ability of cells to form colonies was measured using crystal violet staining. (J) Overexpression of TAF10 measured the migration capacity of cells. MCF7 cells were transfected with either Control‐vec or HA‐TAF10. Transwell assays were used to assess the migration capacity of cells. Scale bar, 20 μm. Data shown in H were analysed by one‐way ANOVA. Data shown in I and J were analysed by t‐test. The blots represented three independent experiments. All data are presented as the mean ± SEM of n = 3. ***p < .001, **p < .01, ns, no significance
