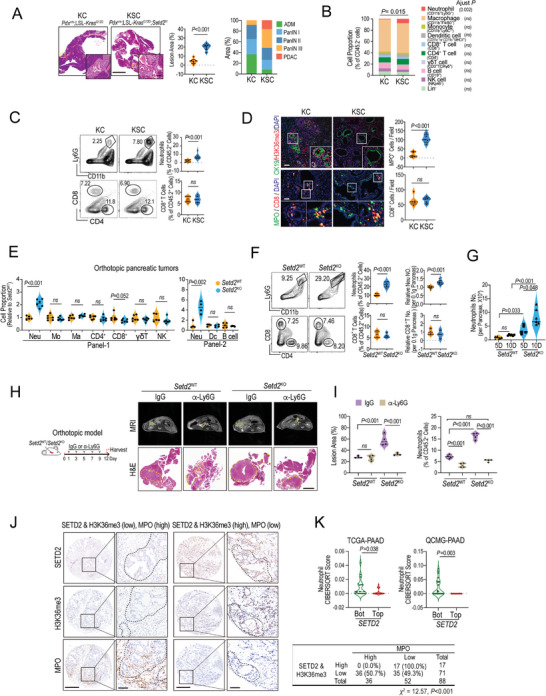
Figure 1.

Setd2 loss reshapes the immune TME, particularly the increase in infiltrating neutrophils, to foster tumor progression. A) Pancreatic tissues from the indicated mice at 13 weeks of age were used for H&E staining and lesion area quantification. Scale bars = 1 mm and 100 µm (for insets). Ratio of ADM, PanINs, and PDAC lesions in affected pancreatic areas from each group (n = 6 per group). B) Polychromatic flow cytometry analysis of leukocyte populations in pancreatic tissues of the indicated mice. The results are shown as the percentage of total CD45.2+ cells for the indicated subpopulations (n = 6 per group). C) Representative flow cytometric plots (left) and percentage of neutrophils and CD8+ T cells (right) in pancreatic tissues of the indicated mice at 13 weeks of age (n = 6–9 per group). D) Representative images (left) and quantification analysis (right) of H3K36me3‐, CK19‐, MPO‐, and CD8‐positive signals in pancreatic tissues of the indicated mice (shown in A) by immunofluorescence staining. Scale bars = 100 µm. E) Relative proportion of leukocyte subpopulations of total CD45.2+ cells in orthotopic Setd2 WT and Setd2 KO pancreatic tumors (n = 4–6 per group). F) Representative plots (left), cell proportion (middle), and absolute numbers (right) of neutrophils and CD8+ T cells in orthotopic Setd2 WT and Setd2 KO pancreatic tumors (n = 6–9 per group). G) The absolute numbers of neutrophils from the indicated orthotopic pancreatic tumors on the 5th and 10th days after inoculation (n = 6 per group). H,I) Mice bearing Setd2 WT and Setd2 KO pancreatic tumors (orthotopic model) were administered IgG and Ly6G neutralizing antibodies (1 mg kg−1 every other day) for 12 days. H) Representative MRI and H&E staining are shown (The yellow dashed line in the MRI image identifies the tumor growth on the pancreas, Scale bar = 2 mm). I) Quantification of lesion area and the percentage of neutrophils in tumor tissues from the indicated groups (right, n = 4 per groups). J) Left panel, representative IHC staining of SETD2, H3K36me3, and MPO in pancreatic tumors. Scale bar = 500 and 100 µm (for insets). Right, statistical analysis of the correlation between MPO and SETD2&H3K36me3 levels in the pancreatic tumor tissue array from the Renji cohort (χ 2 = 12.57, P value < 0.001). K) CIBERSORTx analyses to estimate the abundance of tumor‐infiltrating neutrophils in the database as indicated. Data are represented as the mean ± SEM. Statistical differences were determined with unpaired Student's t test in (A, C–F, and K); Two‐way ANOVA and Bonferroni's multiple comparisons test in (B); Two‐way ANOVA and Tukey's multiple comparisons test in (I); One way ANOVA and Tukey's multiple comparisons test in (G); and Chi‐square with Yates' correction test in (J).
