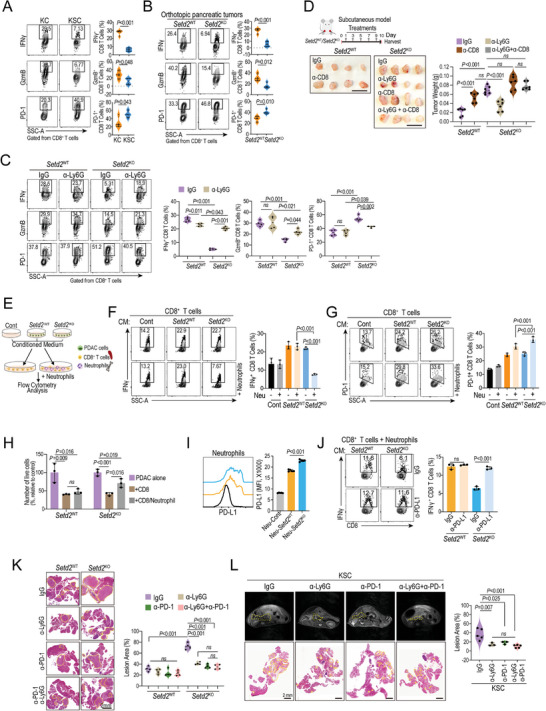
Figure 3.

Neutrophils primed by Setd2‐deficient tumor cells favor immune escape via CD8+ T cells. A,B) Representative plots and statistical analysis of IFNγ and GzmB production, and surface PD‐1 of tumor‐infiltrating CD8+ T cells from the indicated mice (n = 4 per group). C) Setd2 WT and Setd2 KO tumor‐bearing mice (orthotopic model) were administered with IgG and Ly6G neutralizing antibodies (1 mg kg−1, every other day) for 12 days. Representative plots and statistical analysis of IFNγ and GzmB production, and surface PD‐1 of tumor‐infiltrating CD8+ T cells from the indicated mice (n = 4 per group). D) Mice bearing Setd2 WT and Setd2 KO tumors (subcutaneous model) were administered Ly6G neutralizing antibody, CD8 neutralizing antibody, the combination and IgG as a control every other day for 10 days. Tumors were collected for weight quantification (n = 6 per group). Scale bar = 1 cm. E) Schematic diagram of the coculture of CD8+ T cells (sorted from spleen) with and without neutrophils (sorted from bone marrow) upon treatment with different pancreatic tumor cell‐derived conditioned medium (CM). After 24 h, immune cells were used for flow cytometry analysis. F) Representative plots and statistical analysis of IFNγ production by CD8+ T cells from the indicated coculture groups as described in (E). G) Representative plots (left) and statistical analysis (right) of surface PD‐1 on CD8+ T cells from the indicated groups as described in (E). H) CTL‐mediated cytotoxicity analysis of CD8+ T cells on Setd2 WT and Setd2 KO cells with or without neutrophils. I) PD‐L1 levels on neutrophils after priming with the indicated conditioned medium for 24 h. Representative data (left) and statistical analysis (right) are shown. J) Conditioned medium (CM) from Setd2 WT or Setd2 KO pancreatic tumor cells was neutralized with PD‐L1 or control IgG for 6 h and then added to the CD8+ T‐cell and neutrophil coculture system for 24 h before analysis. Representative plots and bar graphs of IFNγ produced by CD8+ T cells are shown. K) Orthotopic Setd2 WT and Setd2 KO tumor‐bearing mice were administered as indicated (α‐Ly6G, 1 mg kg−1, and α‐PD‐1, 1 mg kg−1). Pancreatic tissues were collected for H&E staining (left) and lesion area quantification (right, n = 4 per group). Scale bar = 2 mm. L) Seven‐week‐old KSC mice were administered with Ly6G‐ and PD‐1‐ neutralizing antibodies, and IgG as a control for 6 weeks (twice every week). Representative MRI and H&E staining images are shown, the yellow dashed line in the MRI image identifies the pancreas. Scale bar = 2 mm (left). Quantification of lesion area from the indicated groups (right, n = 3–5 per groups). The experiments had three replicates and were repeated three times (F–J). Data are represented as the mean ± SEM (A–D and K–L) or mean ± SD (F–J). Statistical differences were determined with unpaired Student's t test in (A and B) and one‐way ANOVA and Tukey's multiple comparisons test in (C,D and F–L).
