Figure 4.

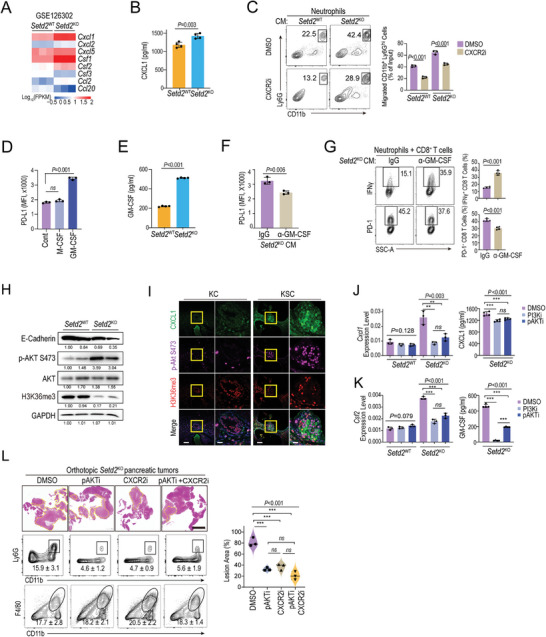
Tumor cell‐intrinsic SETD2 loss reprograms neutrophils via AKT activation‐mediated CXCL1 and GM‐CSF. A) Heatmap of RNA‐Seq data comparing the expression of cytokine‐ and chemokine‐encoding genes between Setd2 WT and Setd2 KO pancreatic tumor cells. B) ELISA analysis of CXCL1 levels in the supernatant of Setd2 WT and Setd2 KO cells. C) Neutrophil chemotaxis assay using 20% conditioned medium from Setd2 KO cells with or without CXCR2 inhibitor. D) PD‐L1 levels on neutrophils upon treatment with M‐CSF and GM‐CSF for 24 h. E) ELISA analysis of GM‐CSF levels in the supernatant of Setd2 WT and Setd2 KO cells. F) Neutrophils were treated with conditioned medium (CM) from Setd2 KO cells neutralized with GM‐CSF antibody or control IgG for 6 h. PD‐L1 levels on neutrophils were determined after 24 h. G) Representative plot (left) and statistical analysis (right) of IFNγ production and surface PD‐1 of CD8+ T cells from the indicated coculture groups. H) E‐cadherin, phosphorylation and total AKT, H3K36me3, and GAPDH levels in orthotopic Setd2 WT and Setd2 KO pancreatic tumors were analyzed by western blot. I) IHC staining of CXCL1 (green), phosphorylated AKT (purple), and H3K36me3 (red) in pancreatic tissue from KC and KSC mice. Scale bars = 100 µm and 20 µm (for inset). J,K) Setd2 WT and Setd2 KO cells were treated with LY294002 (PI3Ki, 500 nM), MK2206 (pAKTi, 500 nM), or DMSO as a control for 24 h. Left, the mRNA levels of J) Cxcl1 and K) Csf2 were determined with qPCR assay. Right panel, ELISA analyses of J) CXCL1 and K) GM‐CSF levels in the supernatant of Setd2 WT and Setd2 KO cells. L) Orthotopic Setd2 KO tumor‐bearing mice were treated with pAKTi (200 mM kg−1, every other day), CXCR2i (1 mg kg−1, every other day), the combination and DMSO as a control for 10 days. Pancreatic tissues were collected for H&E staining (left) and lesion area quantification (right). Representative flow cytometry plots and proportion of neutrophils and macrophages from the indicated groups (n = 3 per group). The experiments had three replicates and were repeated three times (B–G, J–K). Data are represented as the mean ± SD (B–G, and J–K) or mean ± SEM (L). Statistical differences were determined with unpaired Student's t test in (B,C and E–G) and one‐way ANOVA and Tukey's multiple comparisons test in (D, and J–L). ns, P value > 0.05; *, 0.01 < P value ≤ 0.05; **, 0.001 < P value < 0.01; ***, P value ≤ 0.001.
